27.20 Agregar texto a las gráficas
Texto que no depende de variables
Alternativa 1:
ggplot(data = saber,
       mapping = aes(x = estu_inse_individual,
                     y = punt_ingles)) +
         geom_point(color = "gray40", alpha = 0.7) +
  geom_smooth(method = "lm", formula = y ~ x, color = "steelblue") +
  geom_text(label = "Línea de Tendencia", x = 30, y = 85, size = 4,
            colour = "steelblue", hjust = 0.5)  +
  theme_minimal()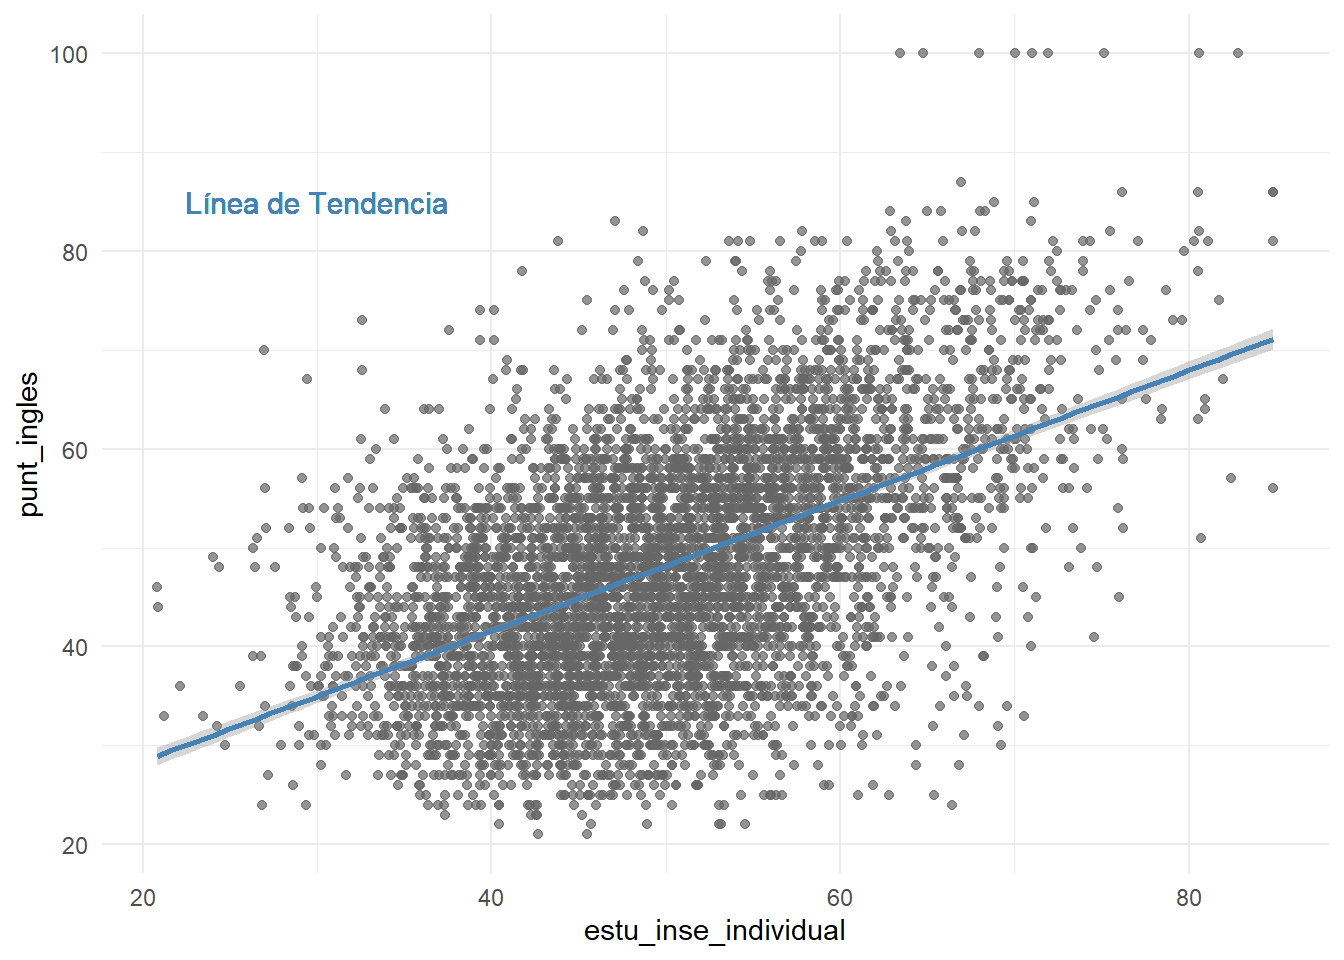
Alternativa 2:
ggplot(data = saber,
       mapping = aes(x = estu_inse_individual,
                     y = punt_ingles)) +
         geom_point(alpha = 0.4, col = '#098') +
  geom_smooth(method = "lm", formula =  y ~ x, color = "gray40") +
  annotate(geom = "text",
           label = "Línea de Tendencia", x = 20, y = 90, size = 4,
           colour = "gray40", hjust = 0.1) +
  theme_minimal()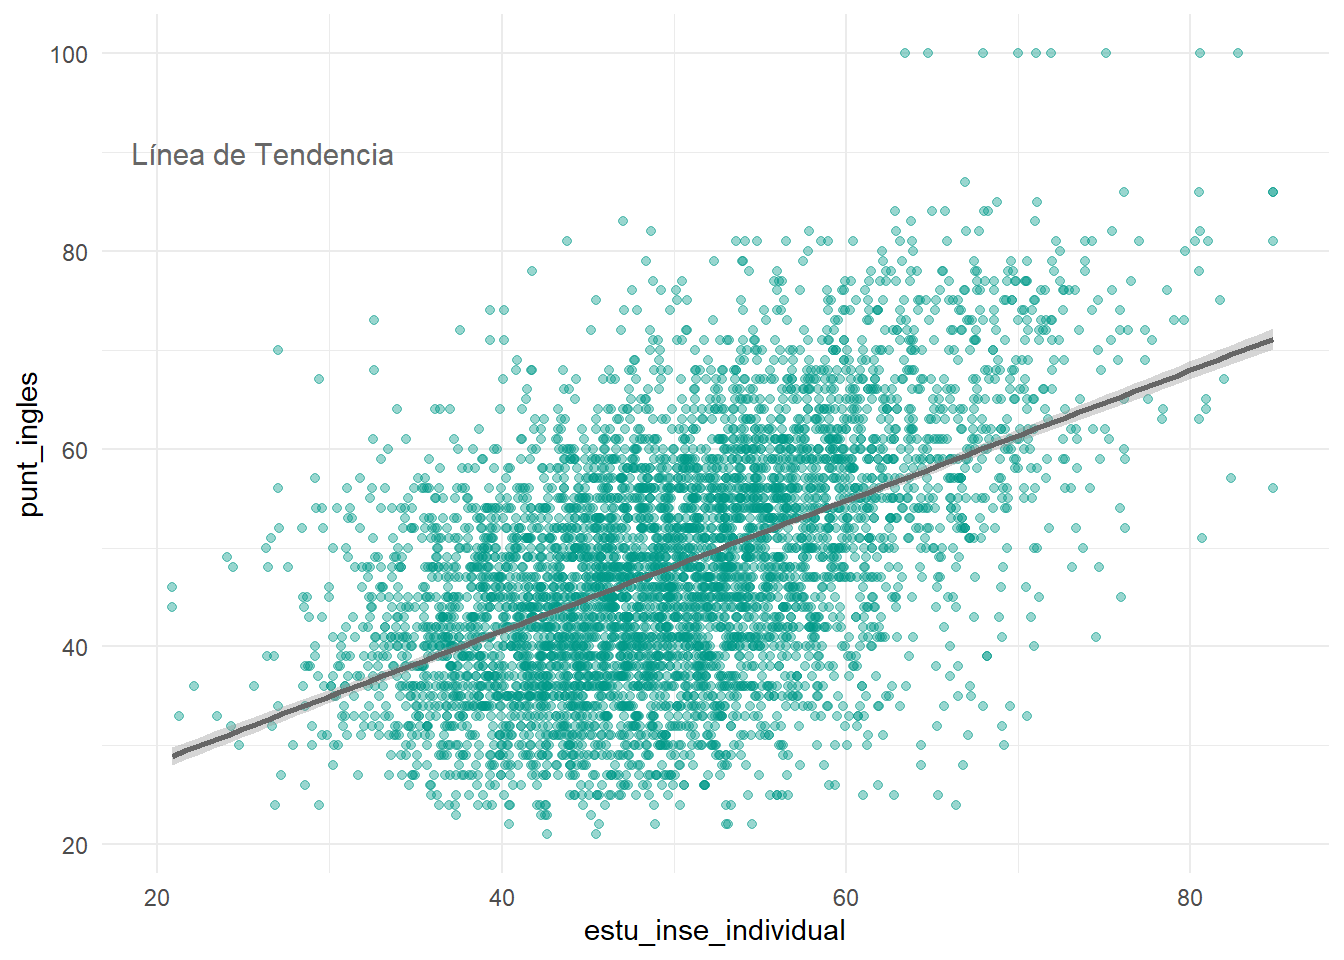
Si depende del nombre de una variable
departamentos <- saber %>%
  group_by(estu_depto_reside) %>%
  dplyr::summarise(across(c(estu_inse_individual, punt_global), function(x) mean(x, na.rm = TRUE)))
departamentos$estu_depto_reside %<>%  stringr::str_to_title()
names(departamentos) <- c('Departamento', 'Inse', 'Puntaje')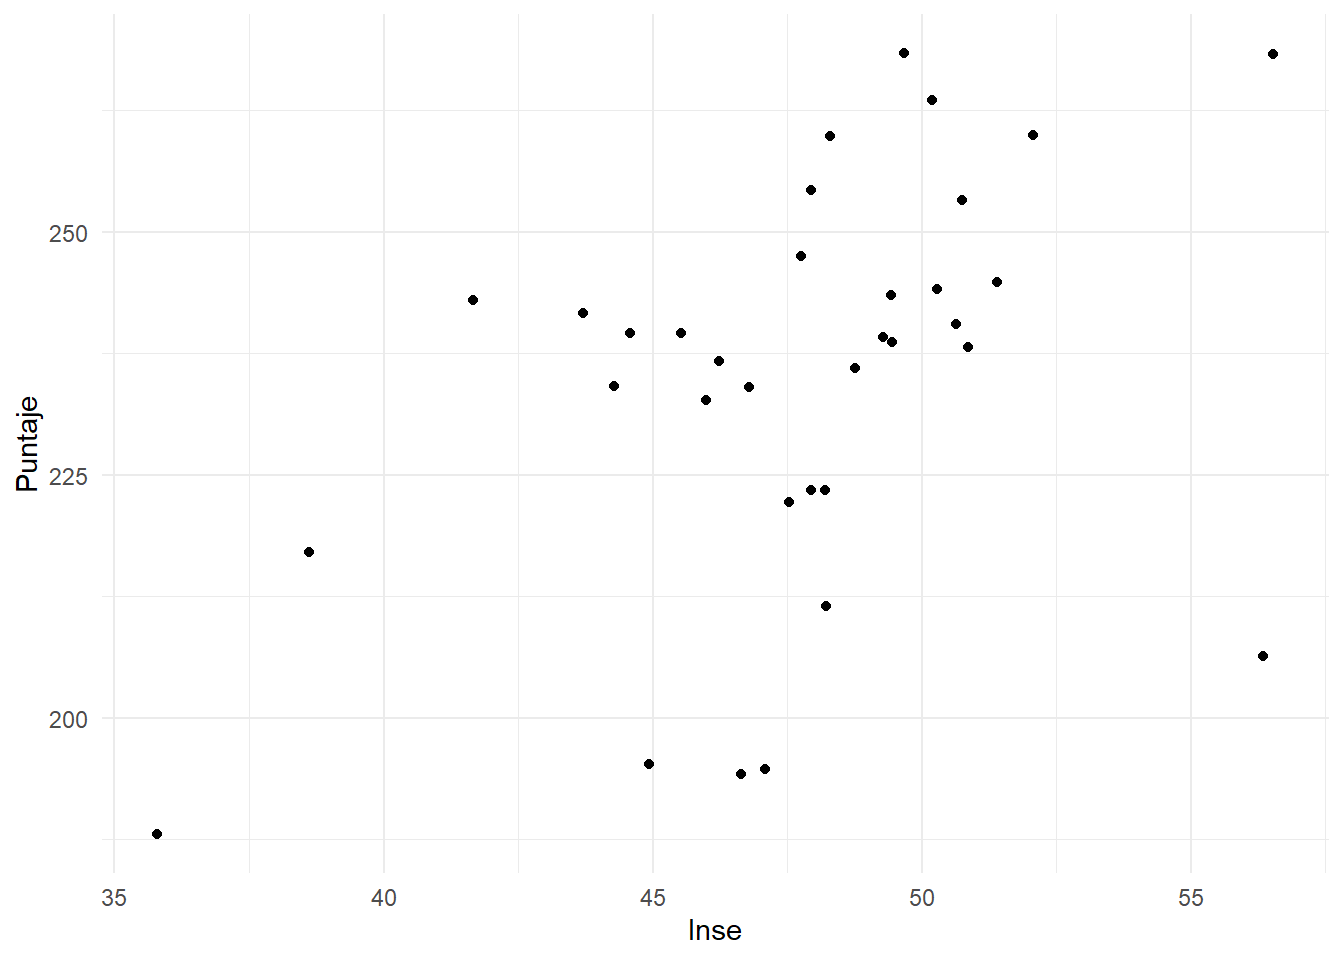
ggplot(data = departamentos, mapping = aes(x = Inse,
                                           y = Puntaje,
                                           label = Departamento)) +
  geom_text(size=3) +
  theme_minimal()
ggplot(data = departamentos, mapping = aes(x = Inse,
                                           y = Puntaje,
                                           label = Departamento)) +
  geom_text(size=3) +
  geom_point() +
  theme_minimal()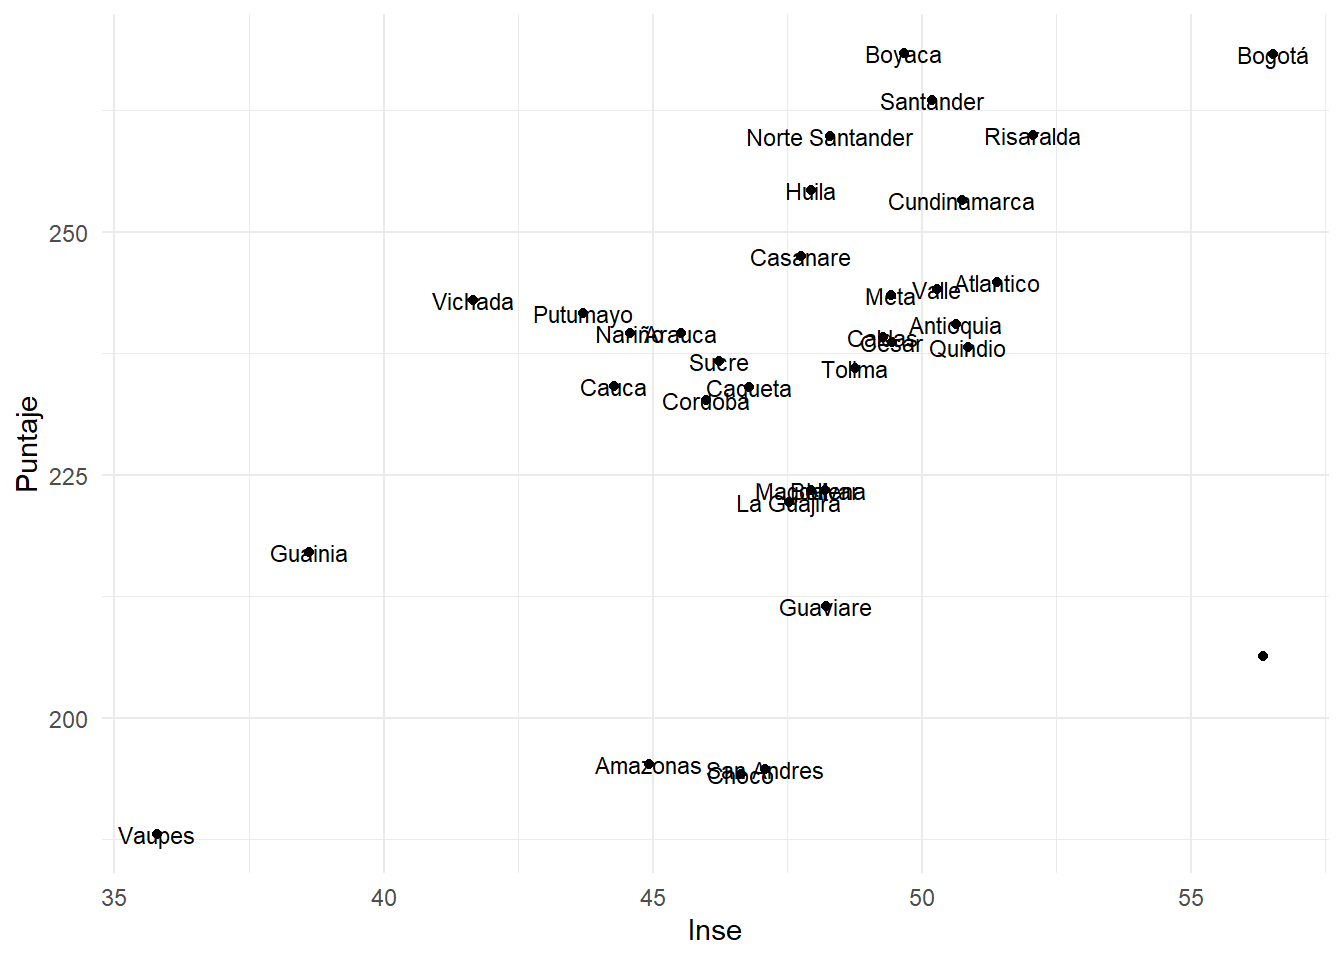
ggplot(data = departamentos,
       mapping = aes(x = Inse,
                     y = Puntaje,
                     label = Departamento)) +
  geom_label(size=3) +
  geom_point() +
  theme_minimal()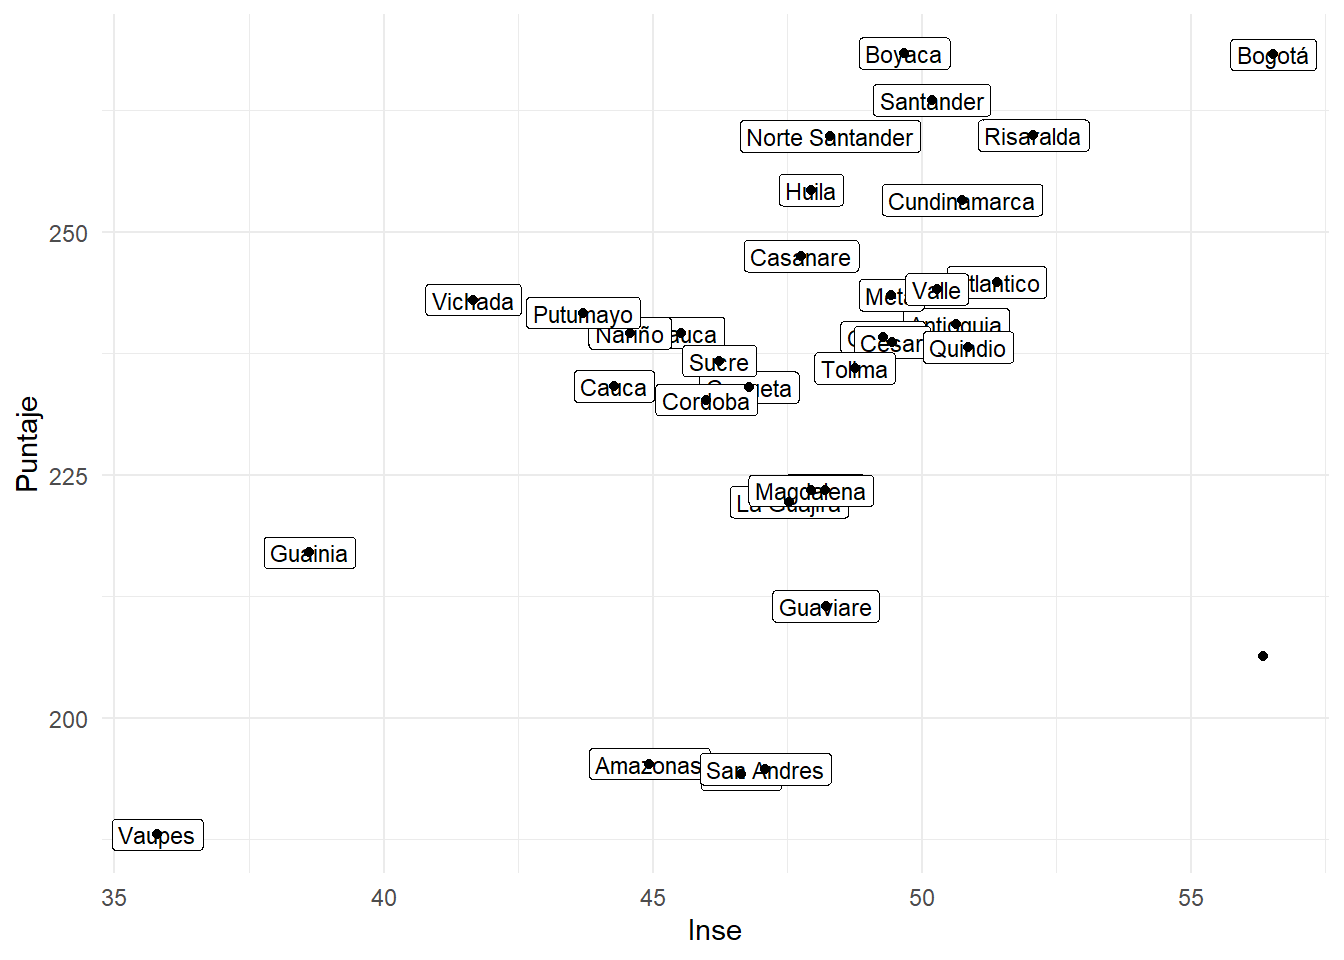
El paquete ‘ggrepel’ tiene una función muy útil\index{Paquete!ggrepel):
ggplot(data = departamentos, mapping = aes(x = Inse,
                                           y = Puntaje,
                                           label = Departamento)) +
  ggrepel::geom_text_repel(size=3) +
  geom_point()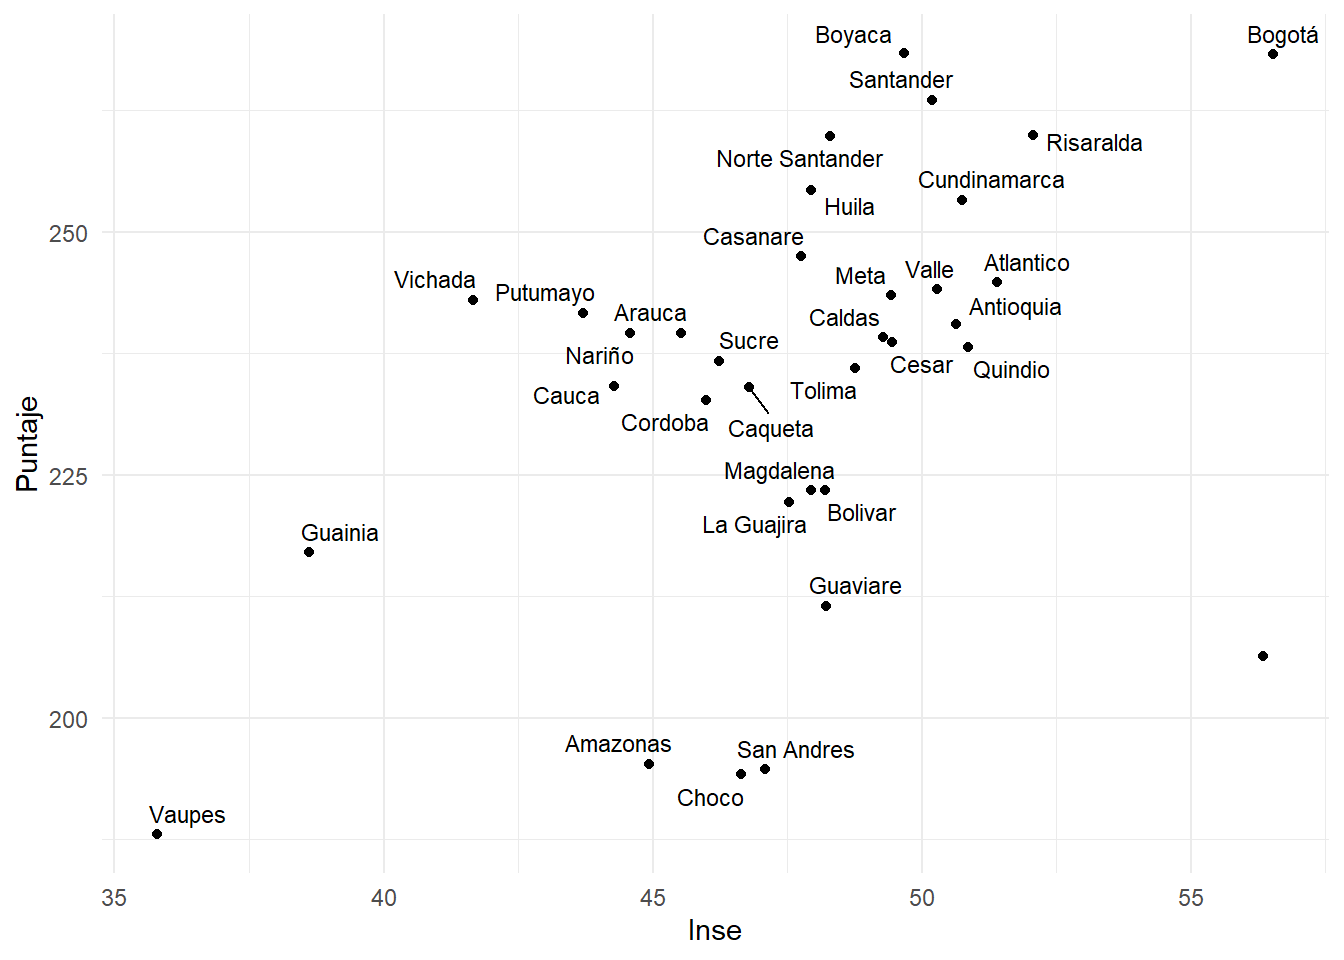
ggplot(data = departamentos, mapping = aes(x = Inse,
                                           y = Puntaje,
                                           label = Departamento)) +
  ggrepel::geom_label_repel(size=3) +
  geom_point() +
  theme_minimal()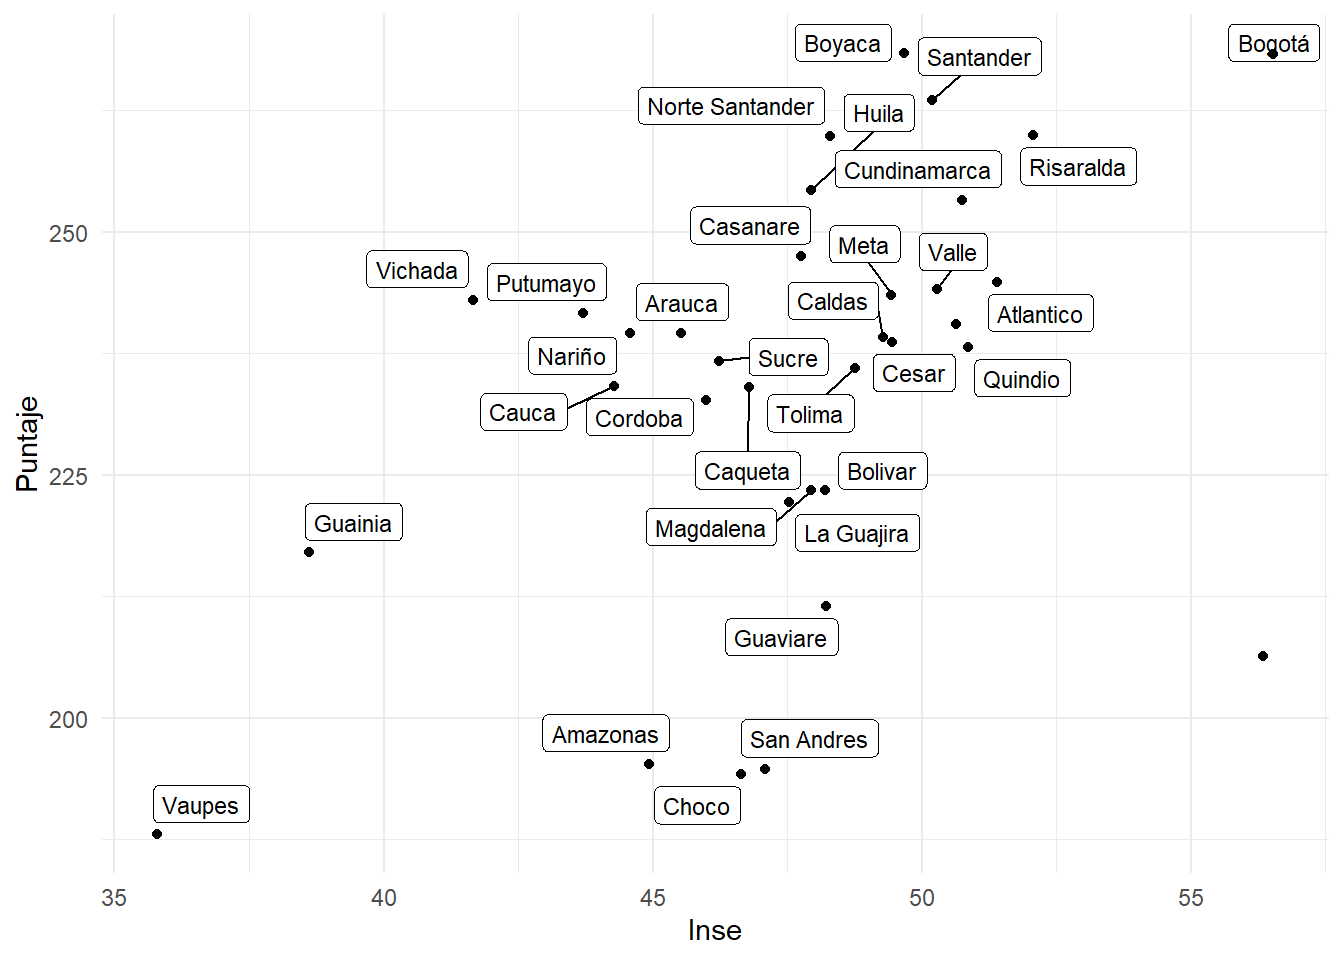
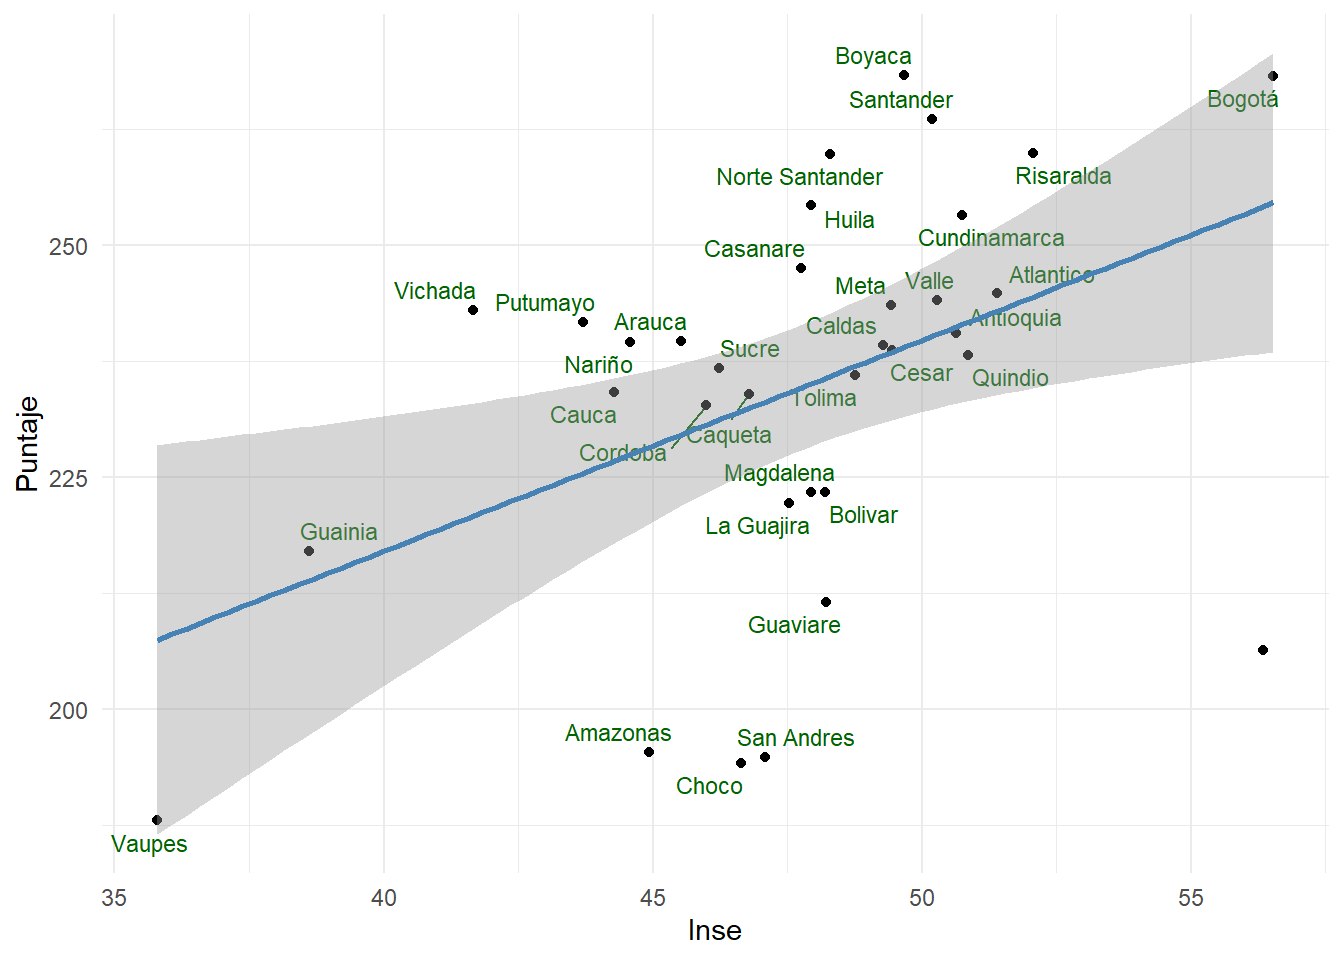
ggplot(data = departamentos, mapping = aes(x = Inse,
                                           y = Puntaje,
                                           label = Departamento)) +
  geom_text_repel(color = "Darkgreen", size=3) +
  geom_point() +
  geom_smooth(method = "lm", color = "steelblue") +
  theme_minimal()