27.22 Personalización avanzada de las gráficas
Para cambiar cualquier aspecto particular de una gráfica que no tenga que ver con los datos se debe agregar la capa theme(). Esta capa tiene un amplio número de argumentos que contiene aspectos que se pueden modificar:
## <theme> List of 144
##  $ line                            : <ggplot2::element_line>
##   ..@ colour       : chr "black"
##   ..@ linewidth    : num 0.5
##   ..@ linetype     : num 1
##   ..@ lineend      : chr "butt"
##   ..@ linejoin     : chr "round"
##   ..@ arrow        : logi FALSE
##   ..@ arrow.fill   : chr "black"
##   ..@ inherit.blank: logi TRUE
##  $ rect                            : <ggplot2::element_rect>
##   ..@ fill         : chr "white"
##   ..@ colour       : chr "black"
##   ..@ linewidth    : num 0.5
##   ..@ linetype     : num 1
##   ..@ linejoin     : chr "round"
##   ..@ inherit.blank: logi TRUE
##  $ text                            : <ggplot2::element_text>
##   ..@ family       : chr ""
##   ..@ face         : chr "plain"
##   ..@ italic       : chr NA
##   ..@ fontweight   : num NA
##   ..@ fontwidth    : num NA
##   ..@ colour       : chr "black"
##   ..@ size         : num 11
##   ..@ hjust        : num 0.5
##   ..@ vjust        : num 0.5
##   ..@ angle        : num 0
##   ..@ lineheight   : num 0.9
##   ..@ margin       : <ggplot2::margin> num [1:4] 0 0 0 0
##   ..@ debug        : logi FALSE
##   ..@ inherit.blank: logi TRUE
##  $ title                           : <ggplot2::element_text>
##   ..@ family       : NULL
##   ..@ face         : NULL
##   ..@ italic       : chr NA
##   ..@ fontweight   : num NA
##   ..@ fontwidth    : num NA
##   ..@ colour       : NULL
##   ..@ size         : NULL
##   ..@ hjust        : NULL
##   ..@ vjust        : NULL
##   ..@ angle        : NULL
##   ..@ lineheight   : NULL
##   ..@ margin       : NULL
##   ..@ debug        : NULL
##   ..@ inherit.blank: logi TRUE
##  $ point                           : <ggplot2::element_point>
##   ..@ colour       : chr "black"
##   ..@ shape        : num 19
##   ..@ size         : num 1.5
##   ..@ fill         : chr "white"
##   ..@ stroke       : num 0.5
##   ..@ inherit.blank: logi TRUE
##  $ polygon                         : <ggplot2::element_polygon>
##   ..@ fill         : chr "white"
##   ..@ colour       : chr "black"
##   ..@ linewidth    : num 0.5
##   ..@ linetype     : num 1
##   ..@ linejoin     : chr "round"
##   ..@ inherit.blank: logi TRUE
##  $ geom                            : <ggplot2::element_geom>
##   ..@ ink        : chr "black"
##   ..@ paper      : chr "white"
##   ..@ accent     : chr "#3366FF"
##   ..@ linewidth  : num 0.5
##   ..@ borderwidth: num 0.5
##   ..@ linetype   : int 1
##   ..@ bordertype : int 1
##   ..@ family     : chr ""
##   ..@ fontsize   : num 3.87
##   ..@ pointsize  : num 1.5
##   ..@ pointshape : num 19
##   ..@ colour     : NULL
##   ..@ fill       : NULL
##  $ spacing                         : 'simpleUnit' num 5.5points
##   ..- attr(*, "unit")= int 8
##  $ margins                         : <ggplot2::margin> num [1:4] 5.5 5.5 5.5 5.5
##  $ aspect.ratio                    : NULL
##  $ axis.title                      : NULL
##  $ axis.title.x                    : <ggplot2::element_text>
##   ..@ family       : NULL
##   ..@ face         : NULL
##   ..@ italic       : chr NA
##   ..@ fontweight   : num NA
##   ..@ fontwidth    : num NA
##   ..@ colour       : NULL
##   ..@ size         : NULL
##   ..@ hjust        : NULL
##   ..@ vjust        : num 1
##   ..@ angle        : NULL
##   ..@ lineheight   : NULL
##   ..@ margin       : <ggplot2::margin> num [1:4] 2.75 0 0 0
##   ..@ debug        : NULL
##   ..@ inherit.blank: logi TRUE
##  $ axis.title.x.top                : <ggplot2::element_text>
##   ..@ family       : NULL
##   ..@ face         : NULL
##   ..@ italic       : chr NA
##   ..@ fontweight   : num NA
##   ..@ fontwidth    : num NA
##   ..@ colour       : NULL
##   ..@ size         : NULL
##   ..@ hjust        : NULL
##   ..@ vjust        : num 0
##   ..@ angle        : NULL
##   ..@ lineheight   : NULL
##   ..@ margin       : <ggplot2::margin> num [1:4] 0 0 2.75 0
##   ..@ debug        : NULL
##   ..@ inherit.blank: logi TRUE
##  $ axis.title.x.bottom             : NULL
##  $ axis.title.y                    : <ggplot2::element_text>
##   ..@ family       : NULL
##   ..@ face         : NULL
##   ..@ italic       : chr NA
##   ..@ fontweight   : num NA
##   ..@ fontwidth    : num NA
##   ..@ colour       : NULL
##   ..@ size         : NULL
##   ..@ hjust        : NULL
##   ..@ vjust        : num 1
##   ..@ angle        : num 90
##   ..@ lineheight   : NULL
##   ..@ margin       : <ggplot2::margin> num [1:4] 0 2.75 0 0
##   ..@ debug        : NULL
##   ..@ inherit.blank: logi TRUE
##  $ axis.title.y.left               : NULL
##  $ axis.title.y.right              : <ggplot2::element_text>
##   ..@ family       : NULL
##   ..@ face         : NULL
##   ..@ italic       : chr NA
##   ..@ fontweight   : num NA
##   ..@ fontwidth    : num NA
##   ..@ colour       : NULL
##   ..@ size         : NULL
##   ..@ hjust        : NULL
##   ..@ vjust        : num 1
##   ..@ angle        : num -90
##   ..@ lineheight   : NULL
##   ..@ margin       : <ggplot2::margin> num [1:4] 0 0 0 2.75
##   ..@ debug        : NULL
##   ..@ inherit.blank: logi TRUE
##  $ axis.text                       : <ggplot2::element_text>
##   ..@ family       : NULL
##   ..@ face         : NULL
##   ..@ italic       : chr NA
##   ..@ fontweight   : num NA
##   ..@ fontwidth    : num NA
##   ..@ colour       : chr "#4D4D4DFF"
##   ..@ size         : 'rel' num 0.8
##   ..@ hjust        : NULL
##   ..@ vjust        : NULL
##   ..@ angle        : NULL
##   ..@ lineheight   : NULL
##   ..@ margin       : NULL
##   ..@ debug        : NULL
##   ..@ inherit.blank: logi TRUE
##  $ axis.text.x                     : <ggplot2::element_text>
##   ..@ family       : NULL
##   ..@ face         : NULL
##   ..@ italic       : chr NA
##   ..@ fontweight   : num NA
##   ..@ fontwidth    : num NA
##   ..@ colour       : NULL
##   ..@ size         : NULL
##   ..@ hjust        : NULL
##   ..@ vjust        : num 1
##   ..@ angle        : NULL
##   ..@ lineheight   : NULL
##   ..@ margin       : <ggplot2::margin> num [1:4] 2.2 0 0 0
##   ..@ debug        : NULL
##   ..@ inherit.blank: logi TRUE
##  $ axis.text.x.top                 : <ggplot2::element_text>
##   ..@ family       : NULL
##   ..@ face         : NULL
##   ..@ italic       : chr NA
##   ..@ fontweight   : num NA
##   ..@ fontwidth    : num NA
##   ..@ colour       : NULL
##   ..@ size         : NULL
##   ..@ hjust        : NULL
##   ..@ vjust        : NULL
##   ..@ angle        : NULL
##   ..@ lineheight   : NULL
##   ..@ margin       : <ggplot2::margin> num [1:4] 0 0 4.95 0
##   ..@ debug        : NULL
##   ..@ inherit.blank: logi TRUE
##  $ axis.text.x.bottom              : <ggplot2::element_text>
##   ..@ family       : NULL
##   ..@ face         : NULL
##   ..@ italic       : chr NA
##   ..@ fontweight   : num NA
##   ..@ fontwidth    : num NA
##   ..@ colour       : NULL
##   ..@ size         : NULL
##   ..@ hjust        : NULL
##   ..@ vjust        : NULL
##   ..@ angle        : NULL
##   ..@ lineheight   : NULL
##   ..@ margin       : <ggplot2::margin> num [1:4] 4.95 0 0 0
##   ..@ debug        : NULL
##   ..@ inherit.blank: logi TRUE
##  $ axis.text.y                     : <ggplot2::element_text>
##   ..@ family       : NULL
##   ..@ face         : NULL
##   ..@ italic       : chr NA
##   ..@ fontweight   : num NA
##   ..@ fontwidth    : num NA
##   ..@ colour       : NULL
##   ..@ size         : NULL
##   ..@ hjust        : num 1
##   ..@ vjust        : NULL
##   ..@ angle        : NULL
##   ..@ lineheight   : NULL
##   ..@ margin       : <ggplot2::margin> num [1:4] 0 2.2 0 0
##   ..@ debug        : NULL
##   ..@ inherit.blank: logi TRUE
##  $ axis.text.y.left                : <ggplot2::element_text>
##   ..@ family       : NULL
##   ..@ face         : NULL
##   ..@ italic       : chr NA
##   ..@ fontweight   : num NA
##   ..@ fontwidth    : num NA
##   ..@ colour       : NULL
##   ..@ size         : NULL
##   ..@ hjust        : NULL
##   ..@ vjust        : NULL
##   ..@ angle        : NULL
##   ..@ lineheight   : NULL
##   ..@ margin       : <ggplot2::margin> num [1:4] 0 4.95 0 0
##   ..@ debug        : NULL
##   ..@ inherit.blank: logi TRUE
##  $ axis.text.y.right               : <ggplot2::element_text>
##   ..@ family       : NULL
##   ..@ face         : NULL
##   ..@ italic       : chr NA
##   ..@ fontweight   : num NA
##   ..@ fontwidth    : num NA
##   ..@ colour       : NULL
##   ..@ size         : NULL
##   ..@ hjust        : NULL
##   ..@ vjust        : NULL
##   ..@ angle        : NULL
##   ..@ lineheight   : NULL
##   ..@ margin       : <ggplot2::margin> num [1:4] 0 0 0 4.95
##   ..@ debug        : NULL
##   ..@ inherit.blank: logi TRUE
##  $ axis.text.theta                 : NULL
##  $ axis.text.r                     : <ggplot2::element_text>
##   ..@ family       : NULL
##   ..@ face         : NULL
##   ..@ italic       : chr NA
##   ..@ fontweight   : num NA
##   ..@ fontwidth    : num NA
##   ..@ colour       : NULL
##   ..@ size         : NULL
##   ..@ hjust        : num 0.5
##   ..@ vjust        : NULL
##   ..@ angle        : NULL
##   ..@ lineheight   : NULL
##   ..@ margin       : <ggplot2::margin> num [1:4] 0 2.2 0 2.2
##   ..@ debug        : NULL
##   ..@ inherit.blank: logi TRUE
##  $ axis.ticks                      : <ggplot2::element_blank>
##  $ axis.ticks.x                    : NULL
##  $ axis.ticks.x.top                : NULL
##  $ axis.ticks.x.bottom             : NULL
##  $ axis.ticks.y                    : NULL
##  $ axis.ticks.y.left               : NULL
##  $ axis.ticks.y.right              : NULL
##  $ axis.ticks.theta                : NULL
##  $ axis.ticks.r                    : NULL
##  $ axis.minor.ticks.x.top          : NULL
##  $ axis.minor.ticks.x.bottom       : NULL
##  $ axis.minor.ticks.y.left         : NULL
##  $ axis.minor.ticks.y.right        : NULL
##  $ axis.minor.ticks.theta          : NULL
##  $ axis.minor.ticks.r              : NULL
##  $ axis.ticks.length               : 'rel' num 0.5
##  $ axis.ticks.length.x             : NULL
##  $ axis.ticks.length.x.top         : NULL
##  $ axis.ticks.length.x.bottom      : NULL
##  $ axis.ticks.length.y             : NULL
##  $ axis.ticks.length.y.left        : NULL
##  $ axis.ticks.length.y.right       : NULL
##  $ axis.ticks.length.theta         : NULL
##  $ axis.ticks.length.r             : NULL
##  $ axis.minor.ticks.length         : 'rel' num 0.75
##  $ axis.minor.ticks.length.x       : NULL
##  $ axis.minor.ticks.length.x.top   : NULL
##  $ axis.minor.ticks.length.x.bottom: NULL
##  $ axis.minor.ticks.length.y       : NULL
##  $ axis.minor.ticks.length.y.left  : NULL
##  $ axis.minor.ticks.length.y.right : NULL
##  $ axis.minor.ticks.length.theta   : NULL
##  $ axis.minor.ticks.length.r       : NULL
##  $ axis.line                       : <ggplot2::element_blank>
##  $ axis.line.x                     : NULL
##  $ axis.line.x.top                 : NULL
##  $ axis.line.x.bottom              : NULL
##  $ axis.line.y                     : NULL
##  $ axis.line.y.left                : NULL
##  $ axis.line.y.right               : NULL
##  $ axis.line.theta                 : NULL
##  $ axis.line.r                     : NULL
##  $ legend.background               : <ggplot2::element_blank>
##  $ legend.margin                   : NULL
##  $ legend.spacing                  : 'rel' num 2
##  $ legend.spacing.x                : NULL
##  $ legend.spacing.y                : NULL
##  $ legend.key                      : <ggplot2::element_blank>
##  $ legend.key.size                 : 'simpleUnit' num 1.2lines
##   ..- attr(*, "unit")= int 3
##  $ legend.key.height               : NULL
##  $ legend.key.width                : NULL
##  $ legend.key.spacing              : NULL
##  $ legend.key.spacing.x            : NULL
##  $ legend.key.spacing.y            : NULL
##  $ legend.key.justification        : NULL
##  $ legend.frame                    : NULL
##  $ legend.ticks                    : NULL
##  $ legend.ticks.length             : 'rel' num 0.2
##  $ legend.axis.line                : NULL
##  $ legend.text                     : <ggplot2::element_text>
##   ..@ family       : NULL
##   ..@ face         : NULL
##   ..@ italic       : chr NA
##   ..@ fontweight   : num NA
##   ..@ fontwidth    : num NA
##   ..@ colour       : NULL
##   ..@ size         : 'rel' num 0.8
##   ..@ hjust        : NULL
##   ..@ vjust        : NULL
##   ..@ angle        : NULL
##   ..@ lineheight   : NULL
##   ..@ margin       : NULL
##   ..@ debug        : NULL
##   ..@ inherit.blank: logi TRUE
##  $ legend.text.position            : NULL
##  $ legend.title                    : <ggplot2::element_text>
##   ..@ family       : NULL
##   ..@ face         : NULL
##   ..@ italic       : chr NA
##   ..@ fontweight   : num NA
##   ..@ fontwidth    : num NA
##   ..@ colour       : NULL
##   ..@ size         : NULL
##   ..@ hjust        : num 0
##   ..@ vjust        : NULL
##   ..@ angle        : NULL
##   ..@ lineheight   : NULL
##   ..@ margin       : NULL
##   ..@ debug        : NULL
##   ..@ inherit.blank: logi TRUE
##  $ legend.title.position           : NULL
##  $ legend.position                 : chr "right"
##  $ legend.position.inside          : NULL
##  $ legend.direction                : NULL
##  $ legend.byrow                    : NULL
##  $ legend.justification            : chr "center"
##  $ legend.justification.top        : NULL
##  $ legend.justification.bottom     : NULL
##  $ legend.justification.left       : NULL
##  $ legend.justification.right      : NULL
##  $ legend.justification.inside     : NULL
##   [list output truncated]
##  @ complete: logi TRUE
##  @ validate: logi TRUE
Algunas funciones relacionadas a theme() que sólo aplica si no se ha añadido una capa theme() al gráfico en construcción:
theme_get()para conocer las características actuales del tema tomado por defecto.theme_set()para cambiar globalmente el tema por defecto.theme_update()para cambiar alguna característica del tema por defecto.
Ejemplo
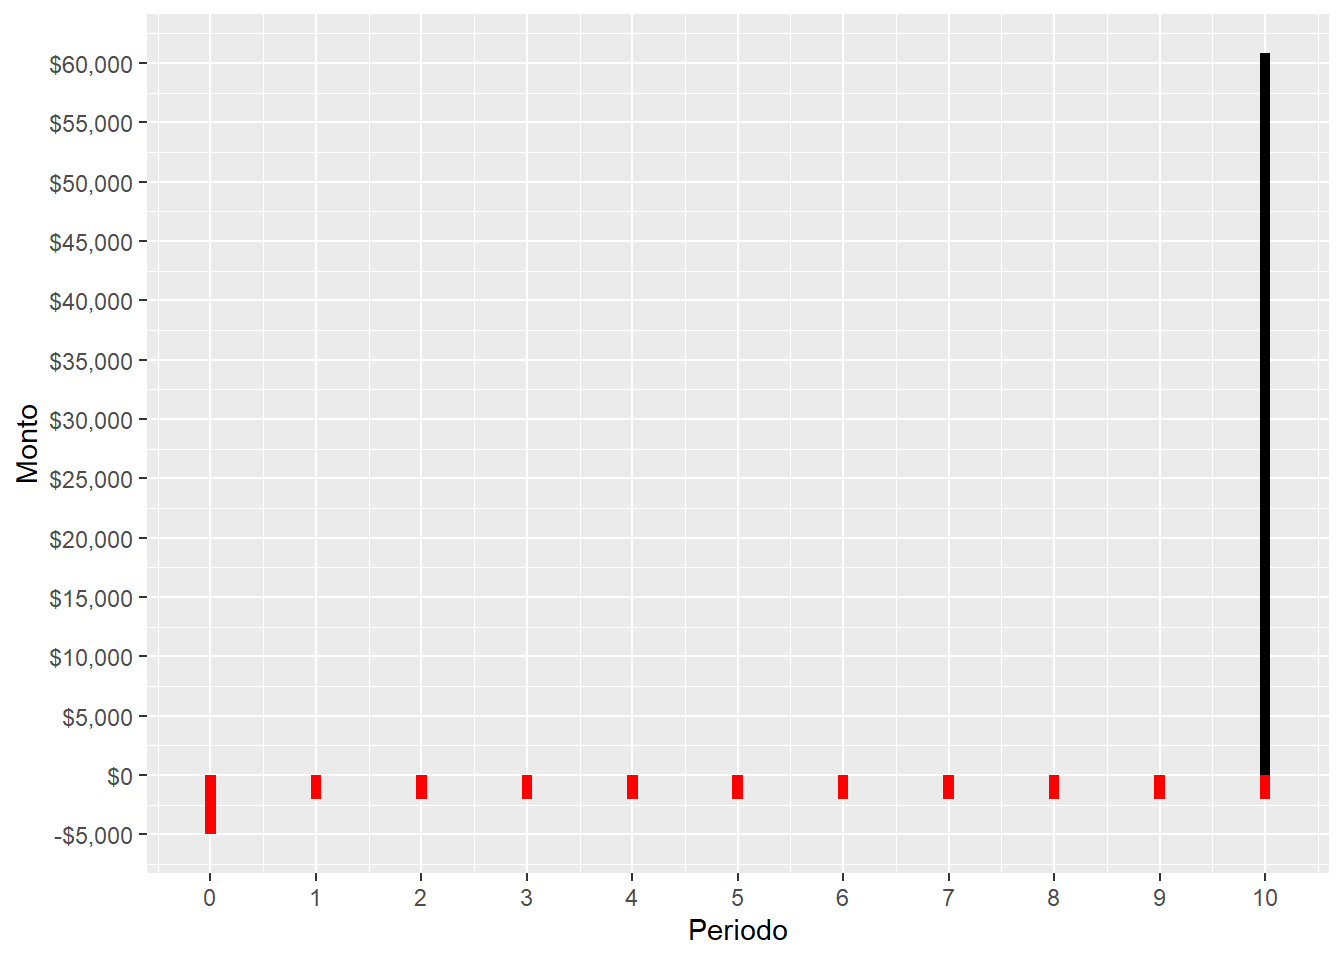
Sea un pequeño data frame que contiene un flujo de caja de algún proyecto:
df <- data.frame(Periodo = 0:10, Futuro = c(rep(0, 10), 60835),
                 Presente = c(-5000, rep(-2000, 10)))
Se establece un tema que aplique para cualquier gráfico:
Se genera un gráfico g:
g <- ggplot(df, aes(Periodo, xend = Periodo)) +
        geom_rect(mapping = aes(xmin= Periodo - 0.05, xmax = Periodo + 0.05,
                                ymin = 0, ymax = Futuro, fill = 'futuro'), show.legend = F) +
        geom_rect(aes(xmin = Periodo - 0.05, xmax = Periodo + 0.05, ymin = 0,
                      ymax = Presente, fill = 'Presente'), show.legend = F) +
        scale_fill_manual('Direction', values = c('Presente' = 'red', 'futuro' = 'black')) +
        scale_x_continuous(breaks = 0:10, expand = c(0.05, 0.05)) + ylab('Monto') +
        scale_y_continuous(labels = scales::dollar, breaks = seq(-5000, 65000, 5000))
Bajo el tema seleccionado, se ve así:
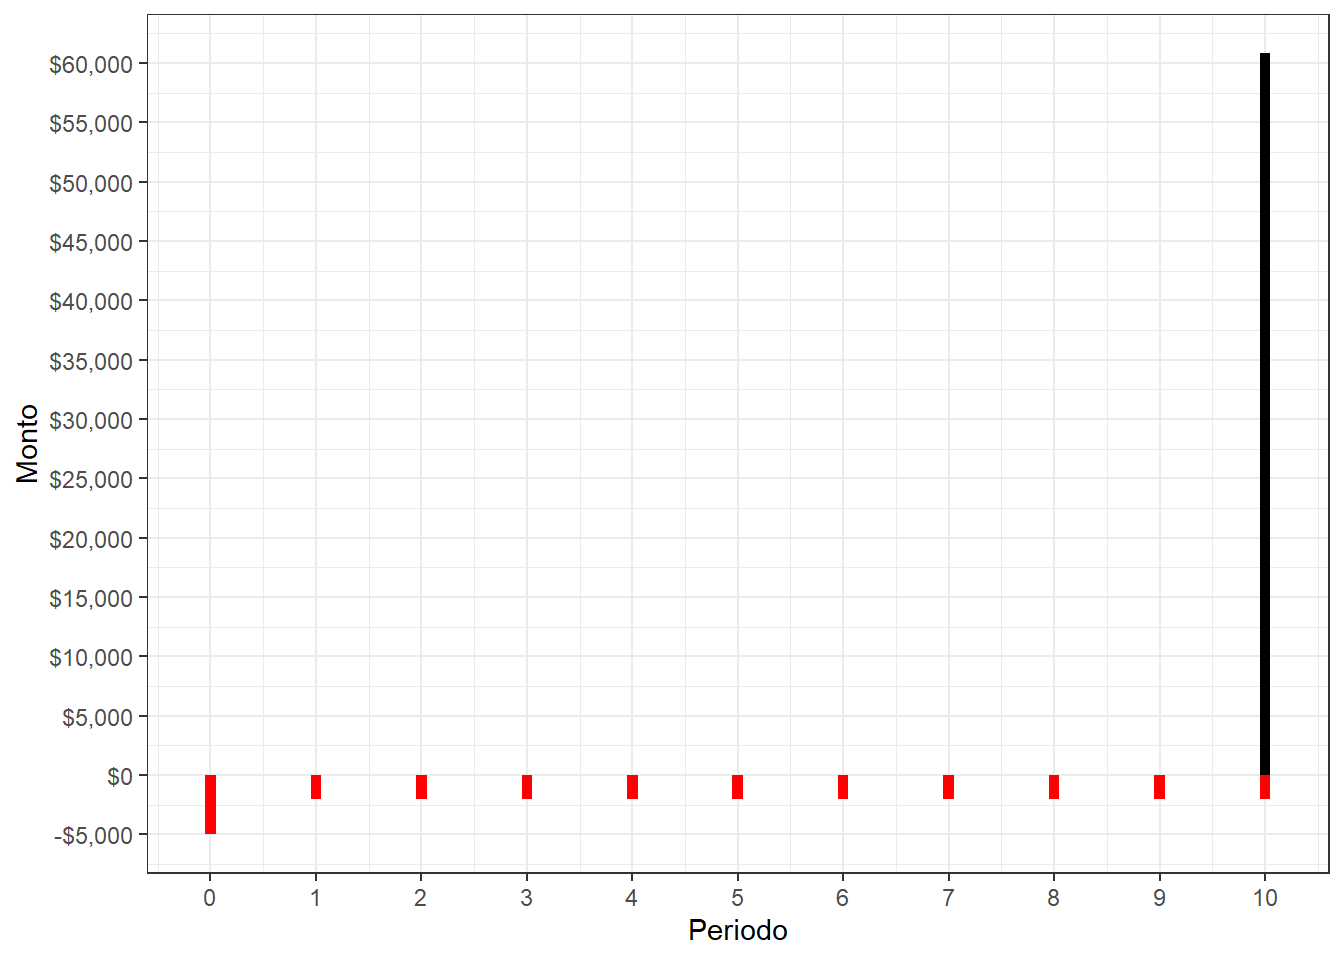
Ahora se cambia al tema una característica en particular:
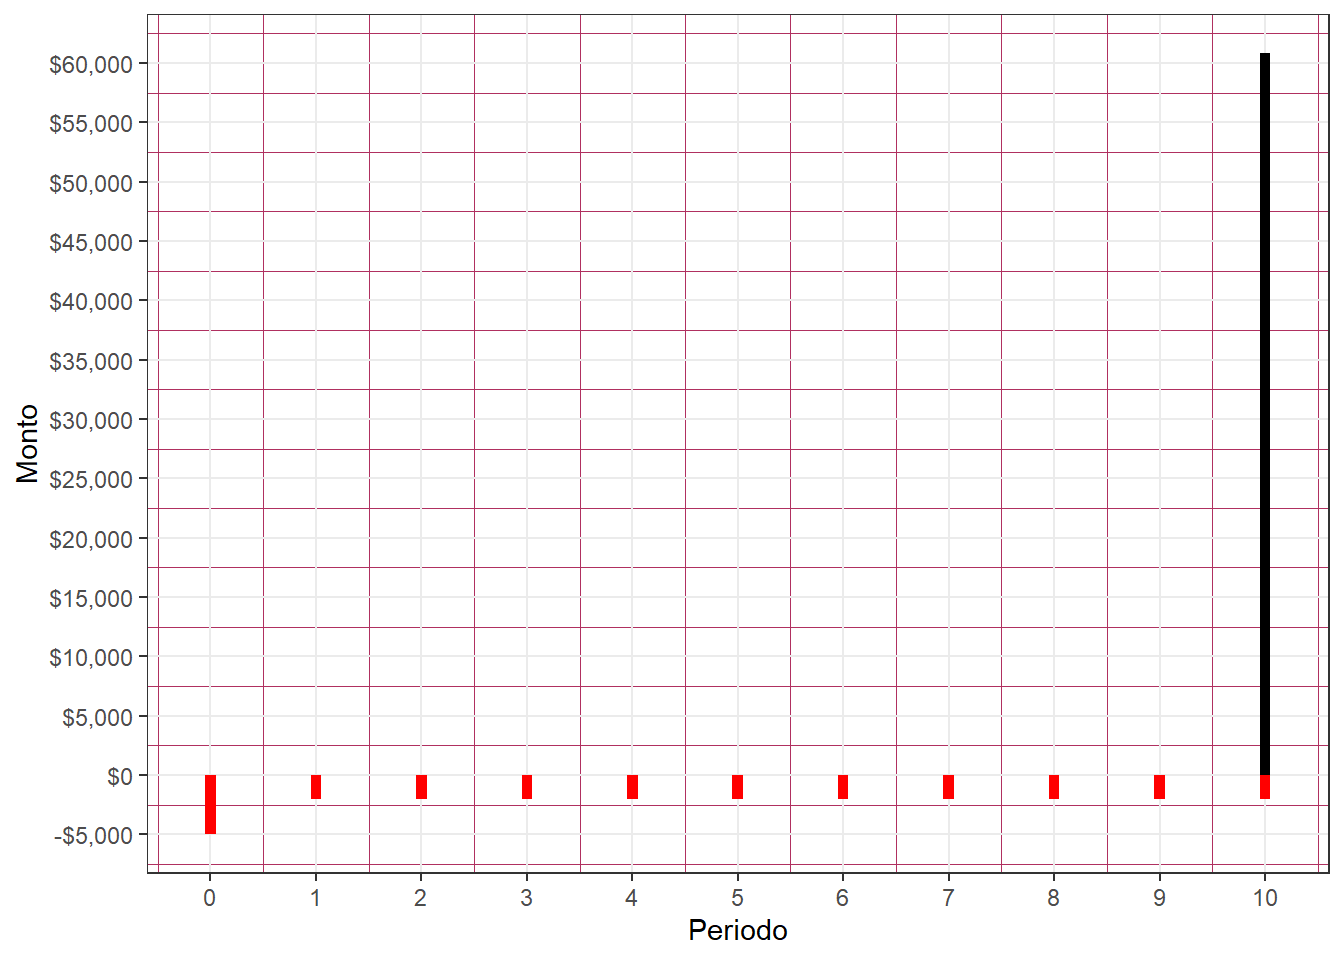
Cambiemos el tema en general: