13.2 Diagrama variables continuas
fig, ax = plt.subplots(figsize=(6, 4), facecolor='whitesmoke')
# ax.set_facecolor('whitesmoke')
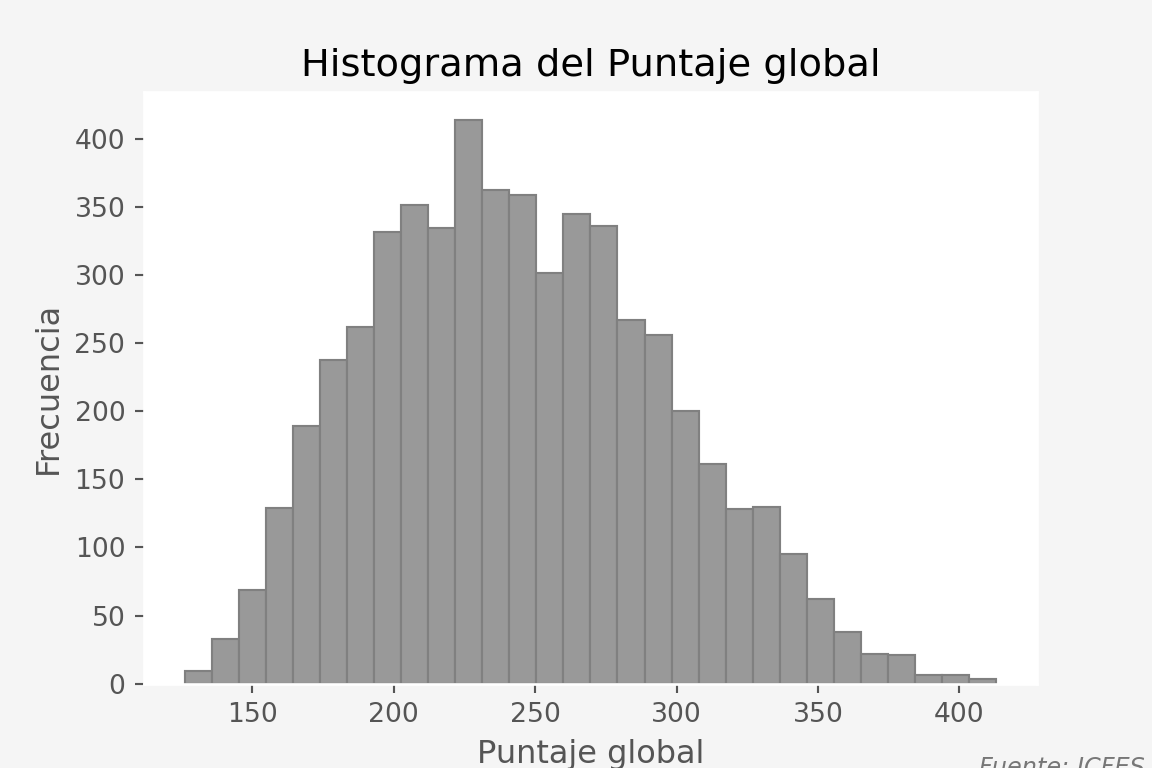
ax.hist(saber['punt_global'],
bins = 30,
color='0.60',
edgecolor='0.50',
linewidth=0.8)
ax.set_xlabel('Puntaje global')
ax.set_ylabel('Frecuencia')
ax.set_title('Histograma del Puntaje global')
ax.set_axisbelow(True)
ax.grid(True, axis='y', alpha=0.25)
fig.text(0.85, 0, 'Fuente: ICFES',
ha='left', va='center', fontsize=9, style='italic', color='#777777')