27.18 Etiquetas de los ejes
El paquete scales tiene algunas funciones útiles para modificar las etiquetas de los valores en los ejes. Estas funciones incluyen label_number , label_comma, label_number_si, label_dollar, label_percent y label_date.
Sea la base el siguiente gráfico:
ggplot(data = saber, mapping = aes(x = fami_estratovivienda, y = after_stat(prop), group = 1)) +
  geom_bar(fill = "gray70", color = "gray90") +
  theme_minimal()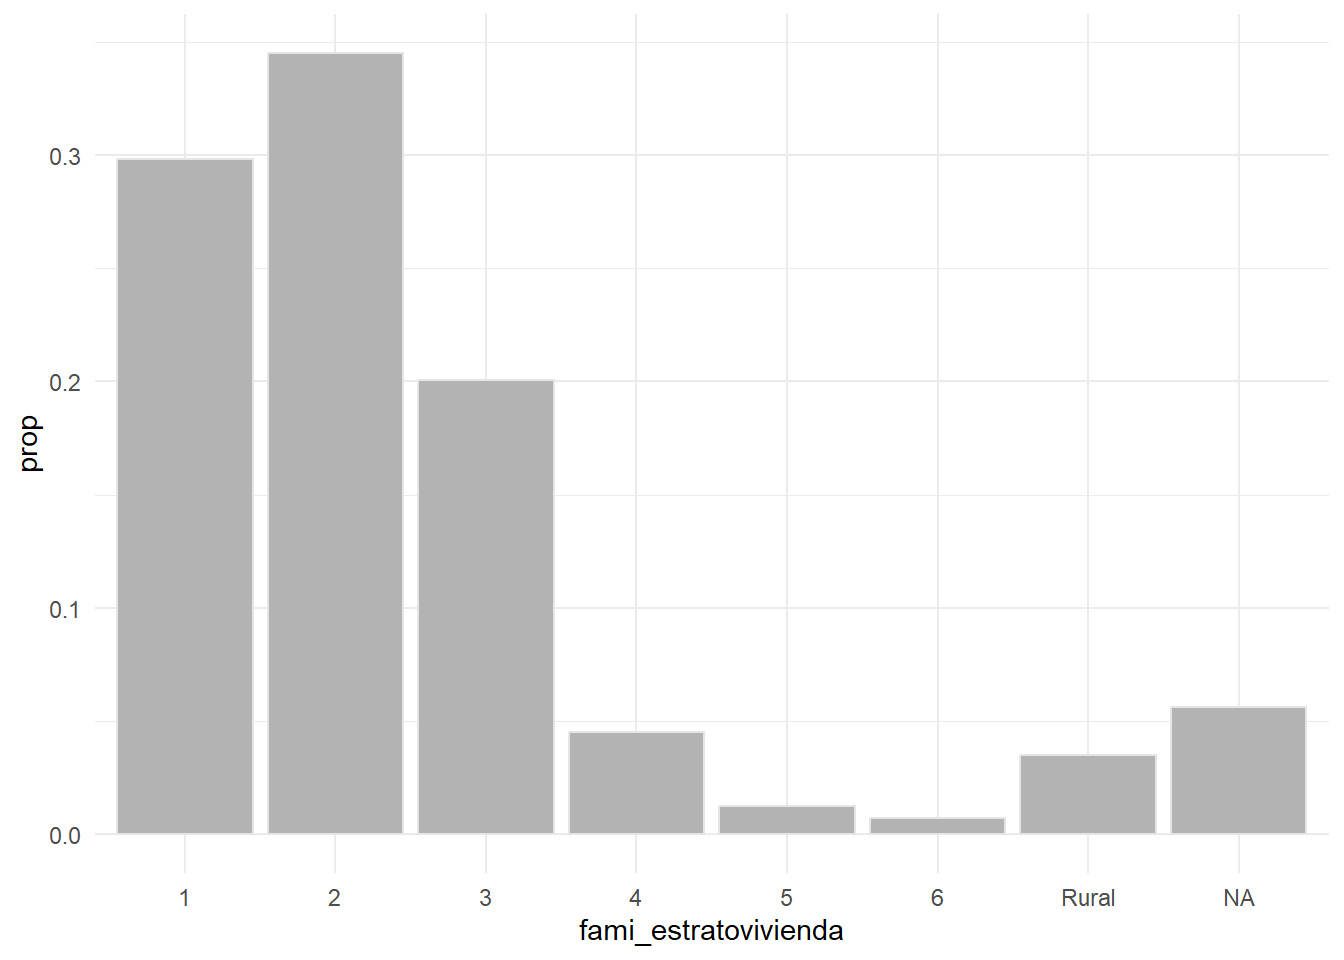
Porcentaje:
ggplot(data = saber, mapping = aes(x = fami_estratovivienda,
                                  y = after_stat(prop), group = 1)) +
  geom_bar(fill = "gray70", color = "gray90") +
  scale_x_discrete(na.translate = FALSE) +
  scale_y_continuous(labels = label_percent()) +
  theme_minimal()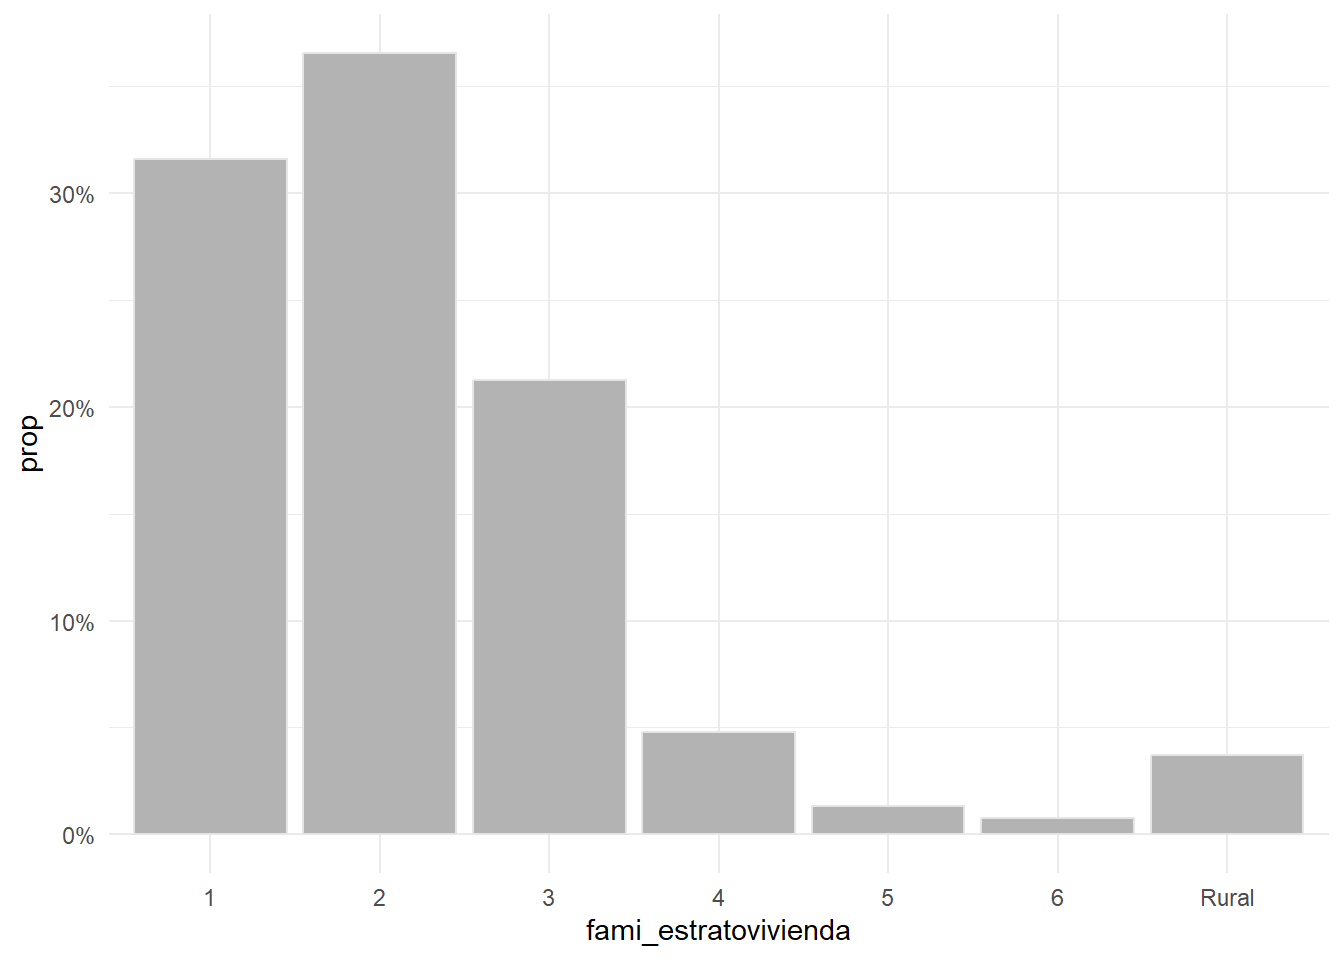
Números con comas:
data <- read.csv2("../Datos/saber11_2019.csv", encoding = 'UTF-8')
names(data) <- tolower(names(data))
ggplot(data = data, mapping = aes(x = fami_estratovivienda)) +
  geom_bar(fill = "gray70", color = "gray90") +
  scale_x_discrete(na.translate = FALSE) +
  scale_y_continuous(labels = label_comma(decimal.mark = ".", big.mark = ",")) +
  theme_minimal()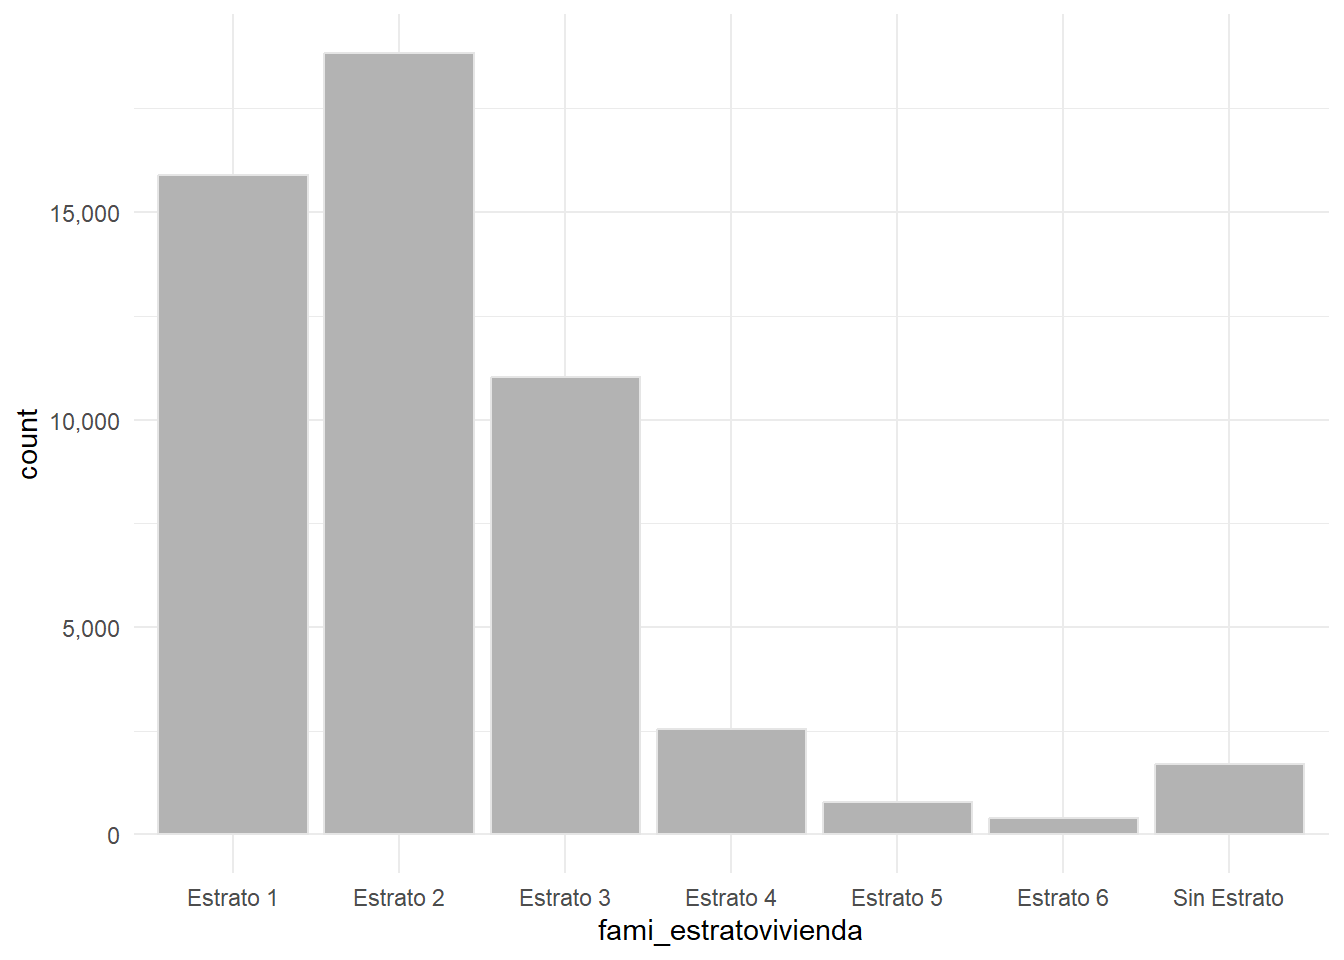
trm <- read.csv("https://www.datos.gov.co/api/views/mcec-87by/rows.csv?accessType=DOWNLOAD")
names(trm) %<>% tolower()
trm <- trm %>%
   mutate(hasta = lubridate::dmy(vigenciahasta))
trm %<>% select(-unidad)
Dollar:
ggplot(data = trm, mapping = aes(x = hasta, y = valor)) +
  geom_line() +
  scale_y_continuous(labels = label_dollar(big.mark = ",",
                                          decimal.mark = ".")) +
  xlab('Vigencia') + ylab('Valor') +
  theme_minimal()
ggplot(data = trm, mapping = aes(x = hasta, y = valor)) +
  geom_line() +
  scale_y_continuous(labels = label_number()) +
  xlab('Vigencia') + ylab('Valor') +
  theme_minimal()
ggplot(data = trm, mapping = aes(x = hasta, y = valor)) +
  geom_line() +
  scale_y_continuous(labels = label_number()) +
  xlab('Vigencia') + ylab('Valor') +
  theme_minimal()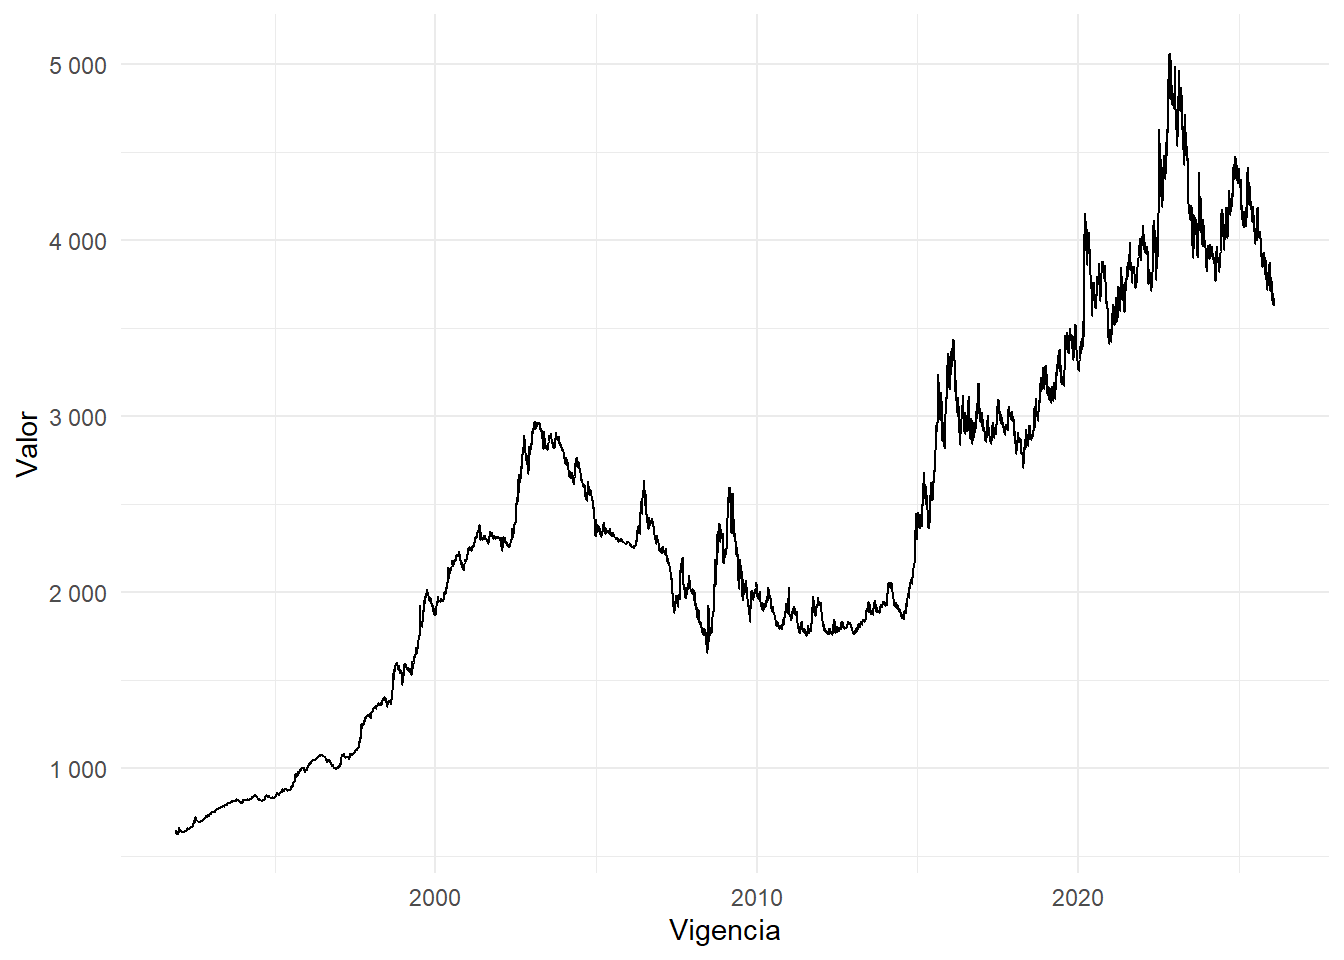
ggplot(data = trm, mapping = aes(x = hasta, y = valor)) +
  geom_line() +
  scale_y_continuous(labels = label_dollar(big.mark = ".",
                                          decimal.mark = ",",
                                          prefix = "COP $")) +
  xlab('Vigencia') + ylab('Valor') +
  theme_minimal()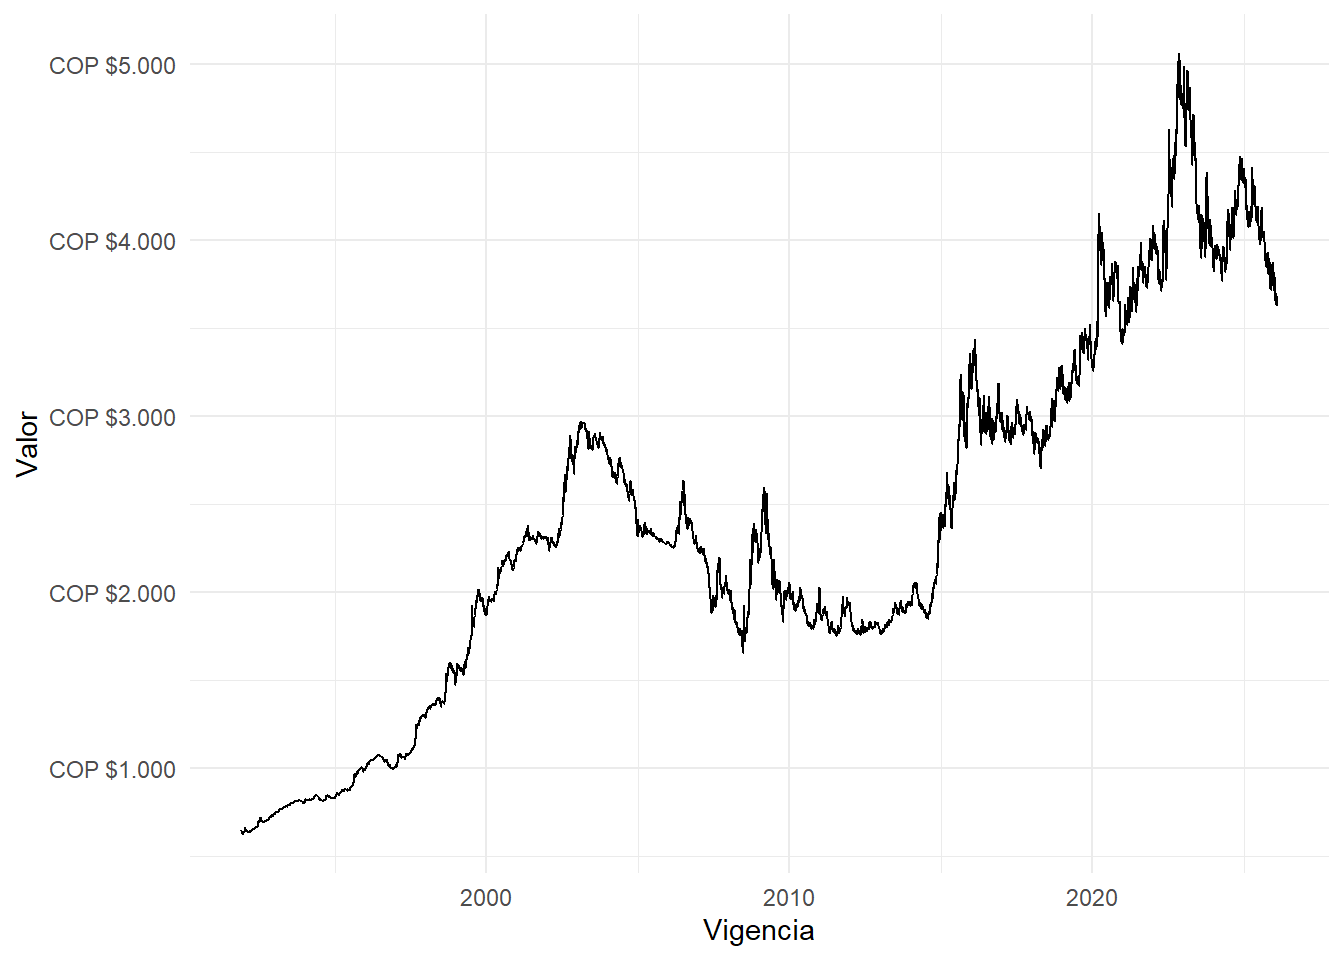
Fecha:
ggplot(data = trm, mapping = aes(x = hasta, y = valor)) +
  geom_line() +
  scale_y_continuous(labels = label_dollar()) +
  scale_x_date(date_breaks = "5 years", date_labels = "%Y %B") +
  xlab('Vigencia') + ylab('Valor')  +
  theme_minimal()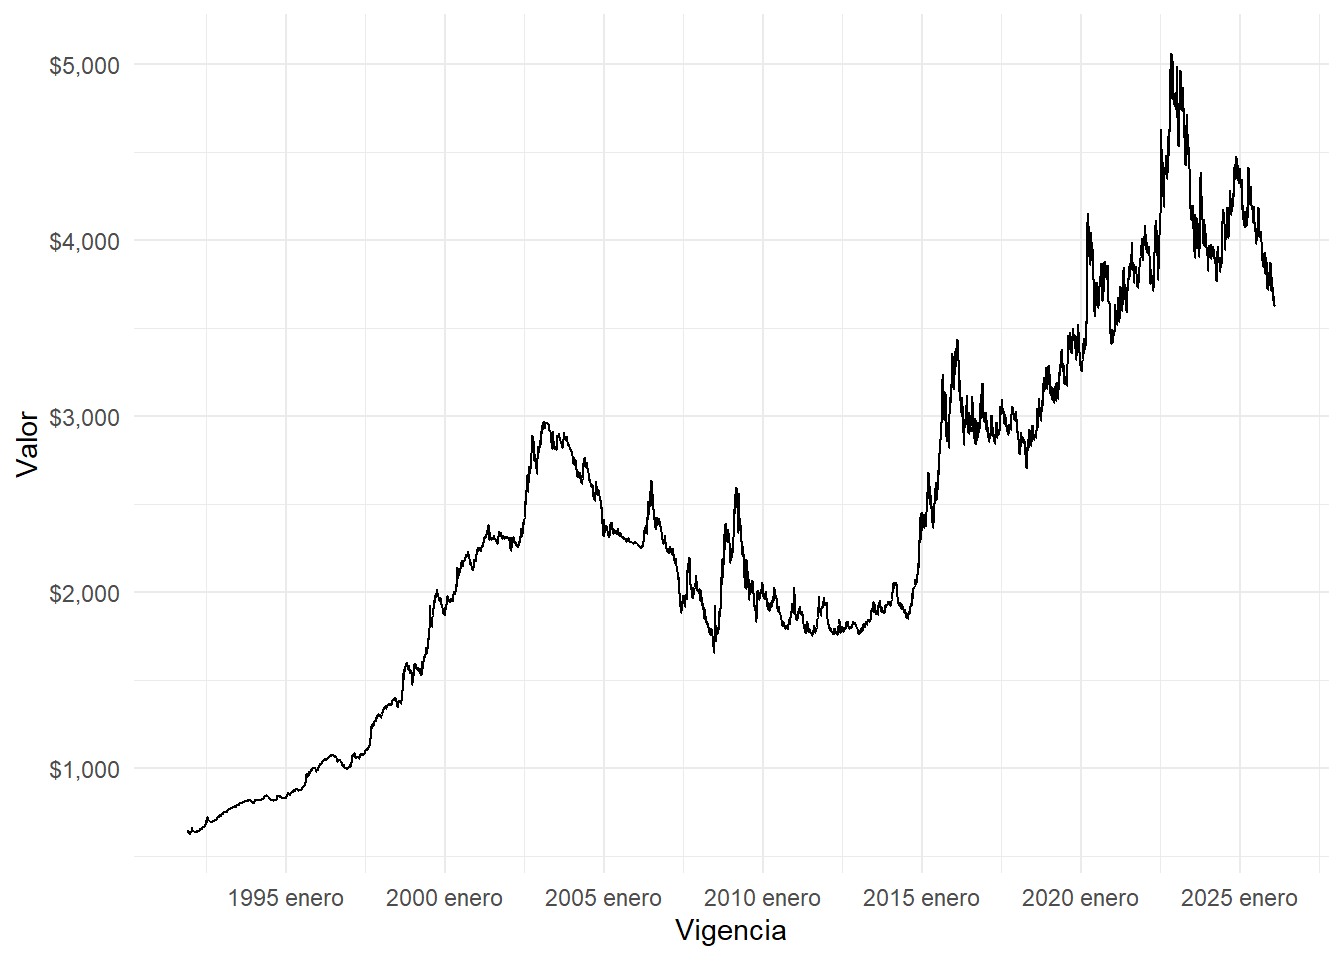
ggplot(data = trm, mapping = aes(x = hasta, y = valor)) +
  geom_line() +
  scale_y_continuous(labels = label_dollar()) +
  scale_x_date(date_breaks = "5 years", date_labels = "%b/%y ") +
  xlab('Vigencia') + ylab('Valor')  +
  theme_minimal()
ggplot(data = trm, mapping = aes(x = hasta, y = valor)) +
  geom_line() +
  scale_y_continuous(labels = label_dollar()) +
  scale_x_date(date_breaks = "1 years", date_labels = "%Y",
               limits = c(as_date("2015-01-01"), as_date("2021-06-30"))) +
  xlab('Vigencia') + ylab('Valor') +
  theme_minimal()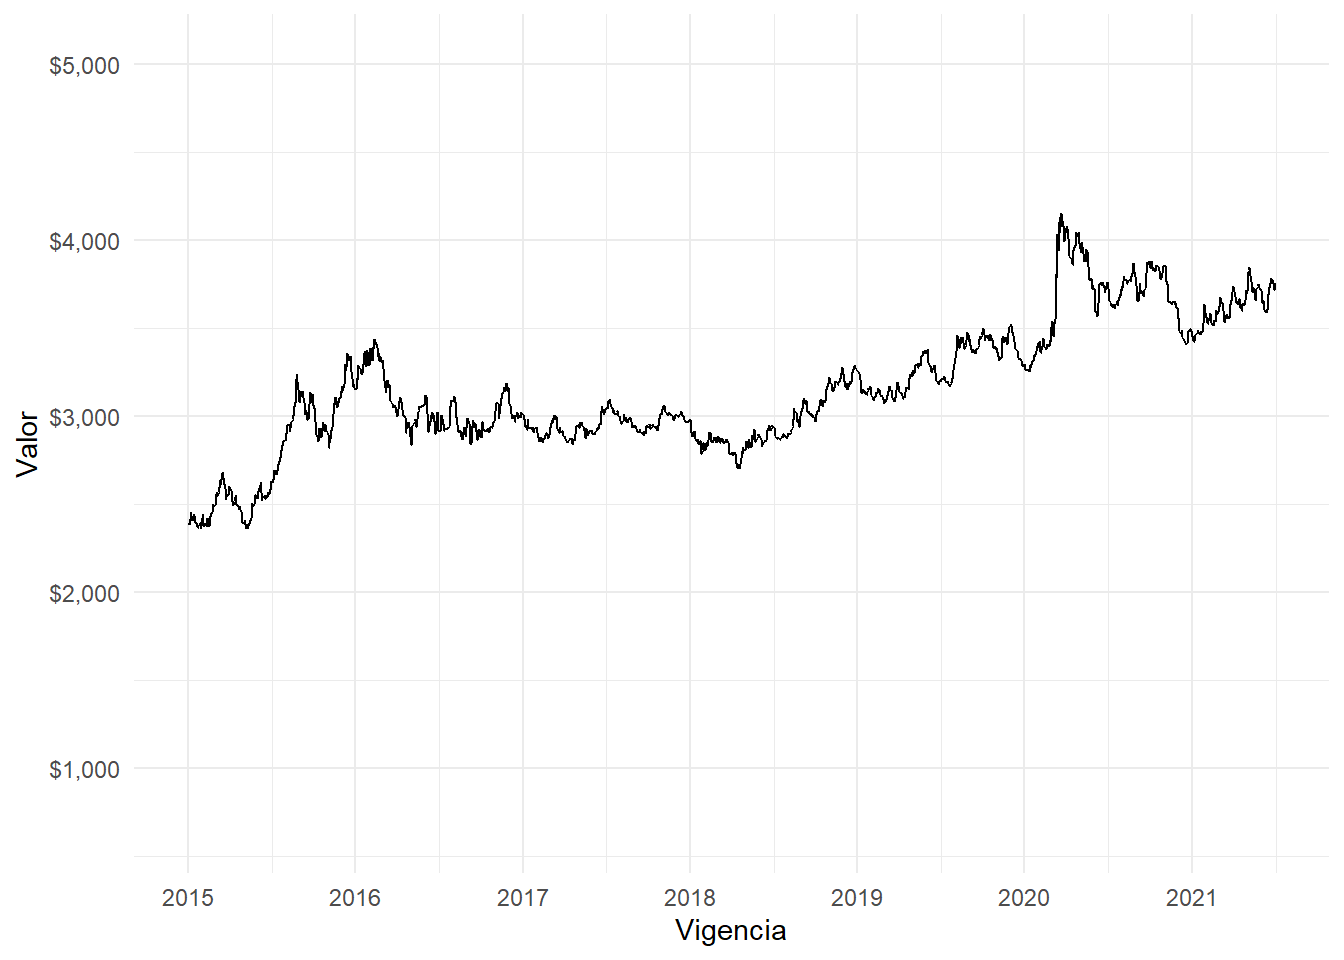
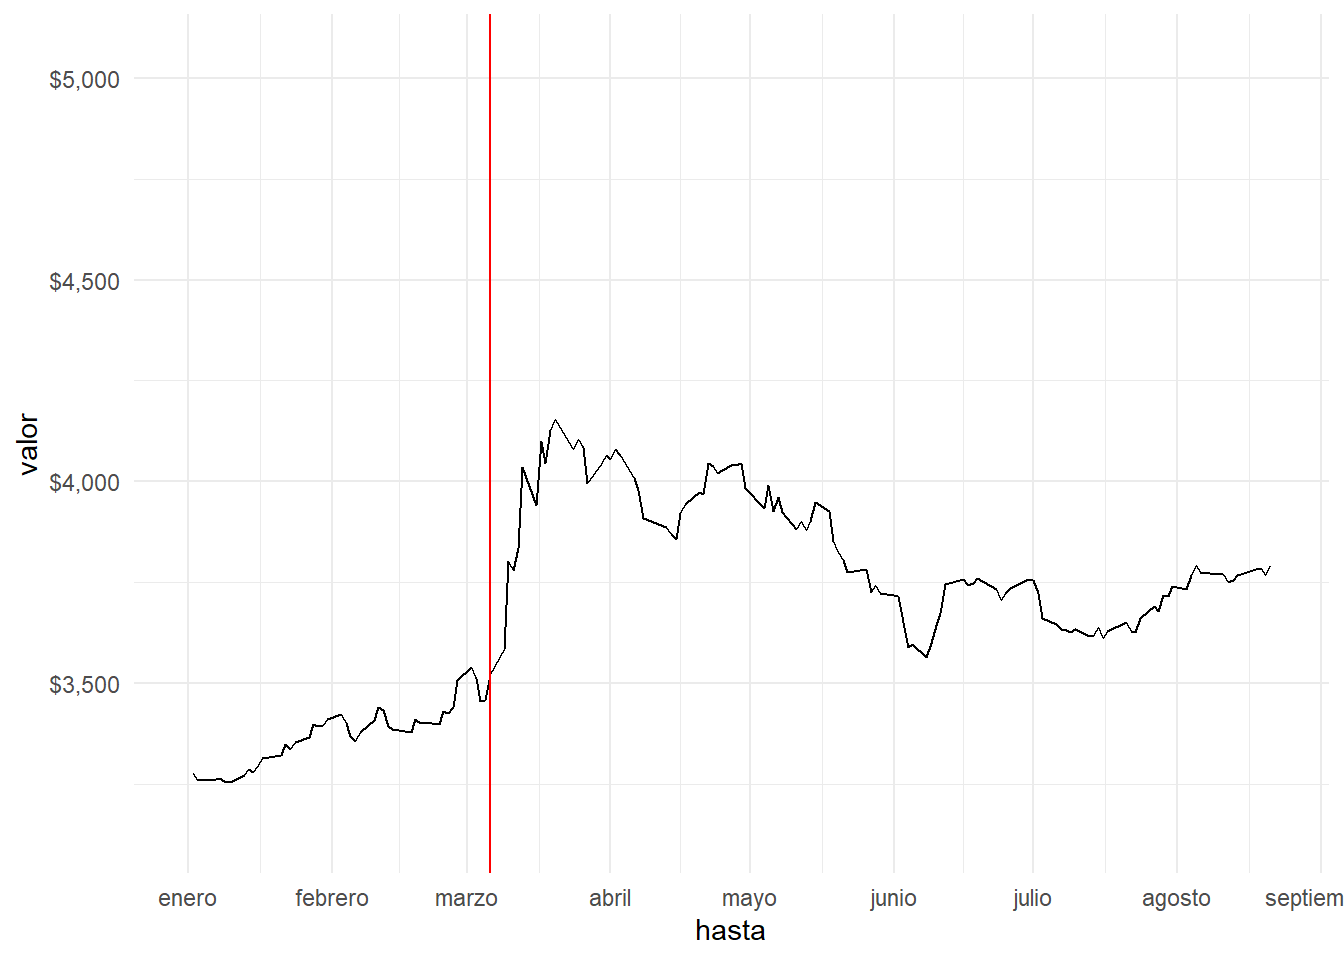
ggplot(data = trm, mapping = aes(x = hasta, y = valor)) +
  geom_line() +
  scale_y_continuous(labels = dollar, limits = c(3125, NA)) +
  scale_x_date(date_breaks = "1 month", date_labels = "%B",
               limits = c(as_date("2020-01-01"), as_date("2020-08-22"))) +
  geom_vline(xintercept = as_date("2020-03-06"), color = "Red")  +
  theme_minimal()