27.27 Incluir varias gráficas en un mismo marco
Instale y active el paquete ggpubr.
Generar gráficas y asignarlas a un objeto:
a <- ggplot(data = saber %>% tidyr::drop_na(), mapping = aes(x = fami_estratovivienda)) +
    geom_bar(col = "gray60", fill = "gray70") +
  labs(y = "Frecuencia", x = "Estrato socioeconómico de la vivienda")
b <- ggplot(data = saber, mapping = aes(x = punt_global)) +
    geom_histogram(col = "gray60", fill = "gray70") +
  labs(y = "Frecuencia", x = "Puntaje global")
combined <- ggpubr::ggarrange(a, b, ncol = 2)
ggpubr::annotate_figure(combined,
                top = ggpubr::text_grob("Distribución por Estrato y Puntaje Global",
                                face = "bold", size = 14))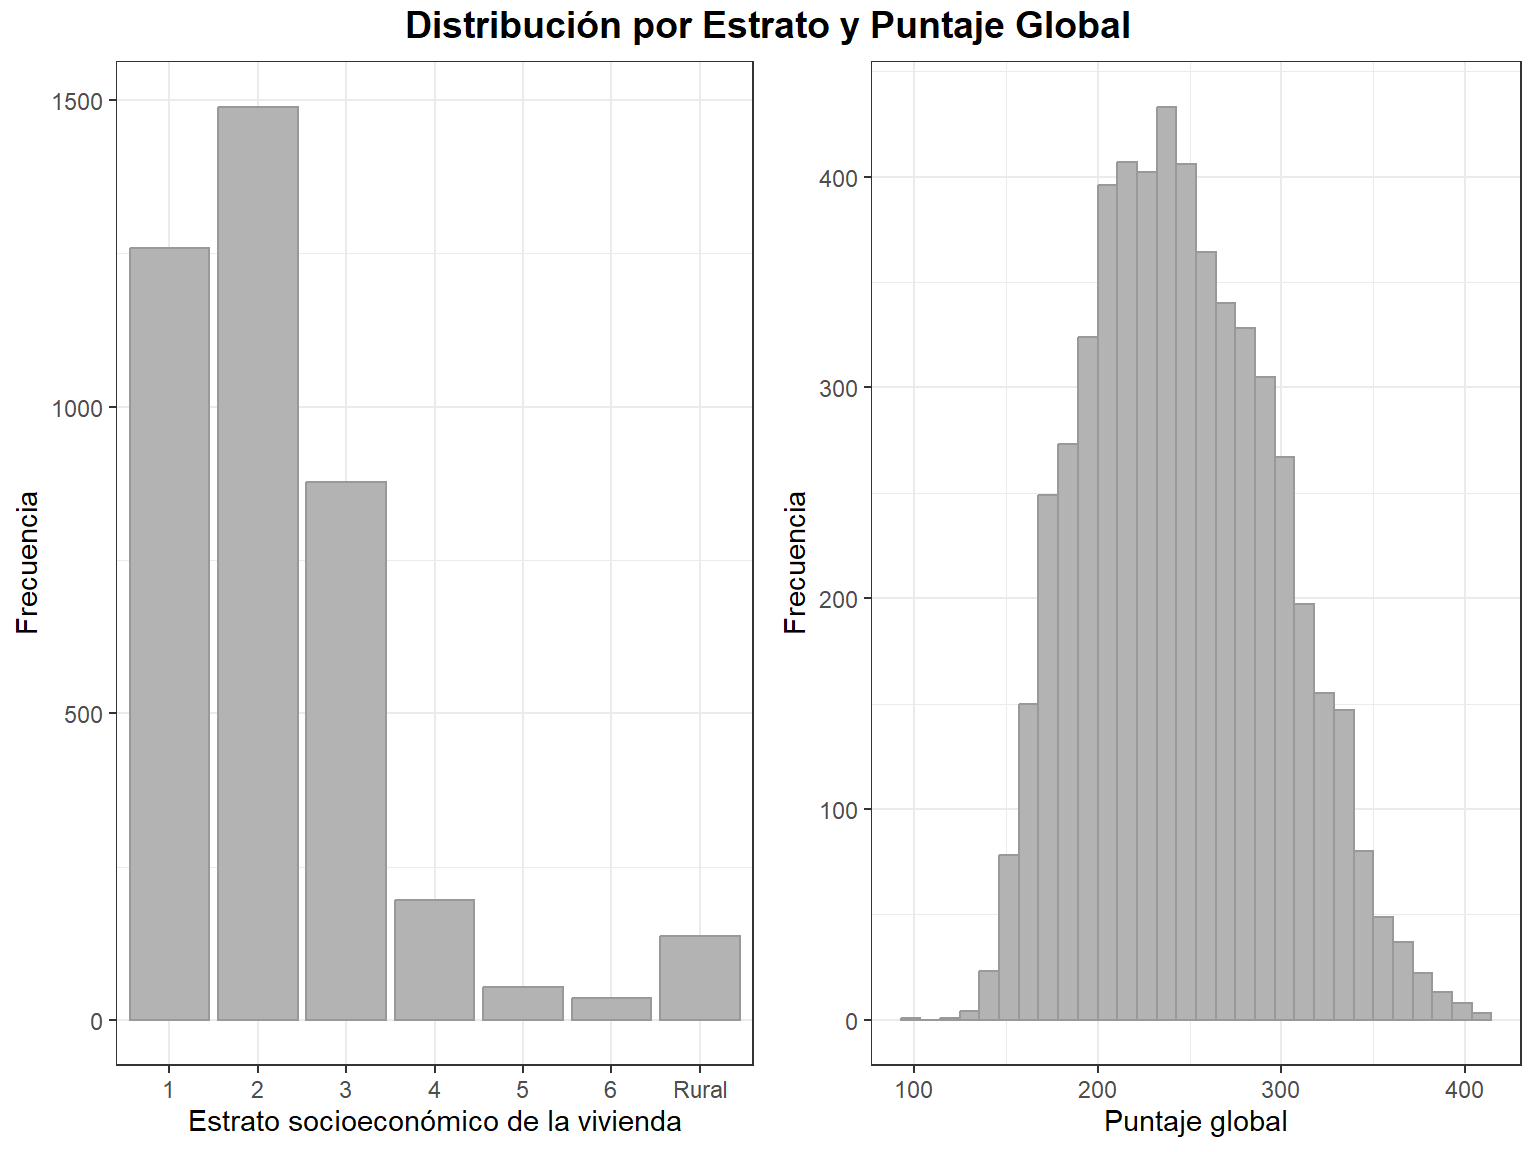
En ggplot2 hay al menos \(50\) geoms, y hay paquetes que han creado extensiones a ggplot2 que contienen más geoms22.
Funcionalidad adicionada a ggplot2 hacia 2015.↩︎