40.8 Unión de polígonos en mapas
import shapely
from shapely.geometry import Polygon, MultiPolygon
from shapely.ops import unary_union, cascaded_union
from geojson import Feature
import json
import geopandas as gpd
geojson_path = '../Datos/DptosColombia.geo.json'
gdf = gpd.read_file(geojson_path)Para el DANE estas son las regiones:
Regiones Orinoquía, Amazonía e Insular:
Amazonas - 91
Guainía - 94
Guaviare - 95
Putumayo - 86
Vaupés - 97
Arauca - 81
Casanare - 85
Vicahda - 99
San Andrés - 88
dpto_values_to_join = ["91", "94", "95", "86", "97", "81", "85", "99", "88"]
ROrinoquia = gdf[gdf['DPTO'].isin(dpto_values_to_join)]
ROrinoquia.to_file("./Datos/ROrinoquia.geojson", driver="GeoJSON")
Región Central:
Antioquia: 05
Caldas: 17
Risaralda: 66
Quindío: 63
Tolima: 73
Huila: 41
Caquetá 18
dpto_values_to_join = ["05", "17", "66", "63", "73", "41", "18"]
RCentral = gdf[gdf['DPTO'].isin(dpto_values_to_join)]
RCentral.to_file("./Datos/RCentral.geojson", driver="GeoJSON")
Región Pacífica:
Chocó - 27
Cauca - 19
Nariño - 52
Valle del Cauca - 76
dpto_values_to_join = ["27", "19", "52", "76"]
RPacifica = gdf[gdf['DPTO'].isin(dpto_values_to_join)]
RPacifica.to_file("./Datos/RPacifica.geojson", driver="GeoJSON")
Región Oriental:
Norte de Santander: 54
Santander: 68
Boyacá: 15
Cundinamarca: 25
Meta: 50
dpto_values_to_join = ["54", "68", "15", "25", "50"]
ROriental = gdf[gdf['DPTO'].isin(dpto_values_to_join)]
ROriental.to_file("./Datos/ROriental.geojson", driver="GeoJSON")
Región Caribe:
Atlántico - 08
Bolívar - 13
César: 20
Córdoba - 23
Sucre - 70
Magdalena - 47
La Guajira - 44
dpto_values_to_join = ["08", "13", "20", "23", "70", "47", "44"]
RCaribe = gdf[gdf['DPTO'].isin(dpto_values_to_join)]
RCaribe.to_file("./Datos/RCaribe.geojson", driver="GeoJSON")
Bogotá; 11
dpto_values_to_join = ["11"]
RBogota = gdf[gdf['DPTO'].isin(dpto_values_to_join)]
RBogota.to_file("./Datos/RBogota.geojson", driver="GeoJSON")
Se unen:
RCaribe['region_name'] = 'Caribe'
ROriental['region_name'] = 'Oriental'
RCentral['region_name'] = 'Central'
RPacifica['region_name'] = 'Pacifica'
ROrinoquia['region_name'] = 'Orinoquia'
RBogota['region_name'] = 'Bogota'
regiones_gdf = RCaribe
regiones_gdf = gpd.GeoDataFrame(pd.concat(
    [RCaribe, ROriental, RCentral, RPacifica, ROrinoquia, RBogota],
    ignore_index=True
))
# Salve de manera combinada los submapas:
regiones_gdf.to_file("./Datos/regiones.geojson", driver="GeoJSON")
import matplotlib.pyplot as plt
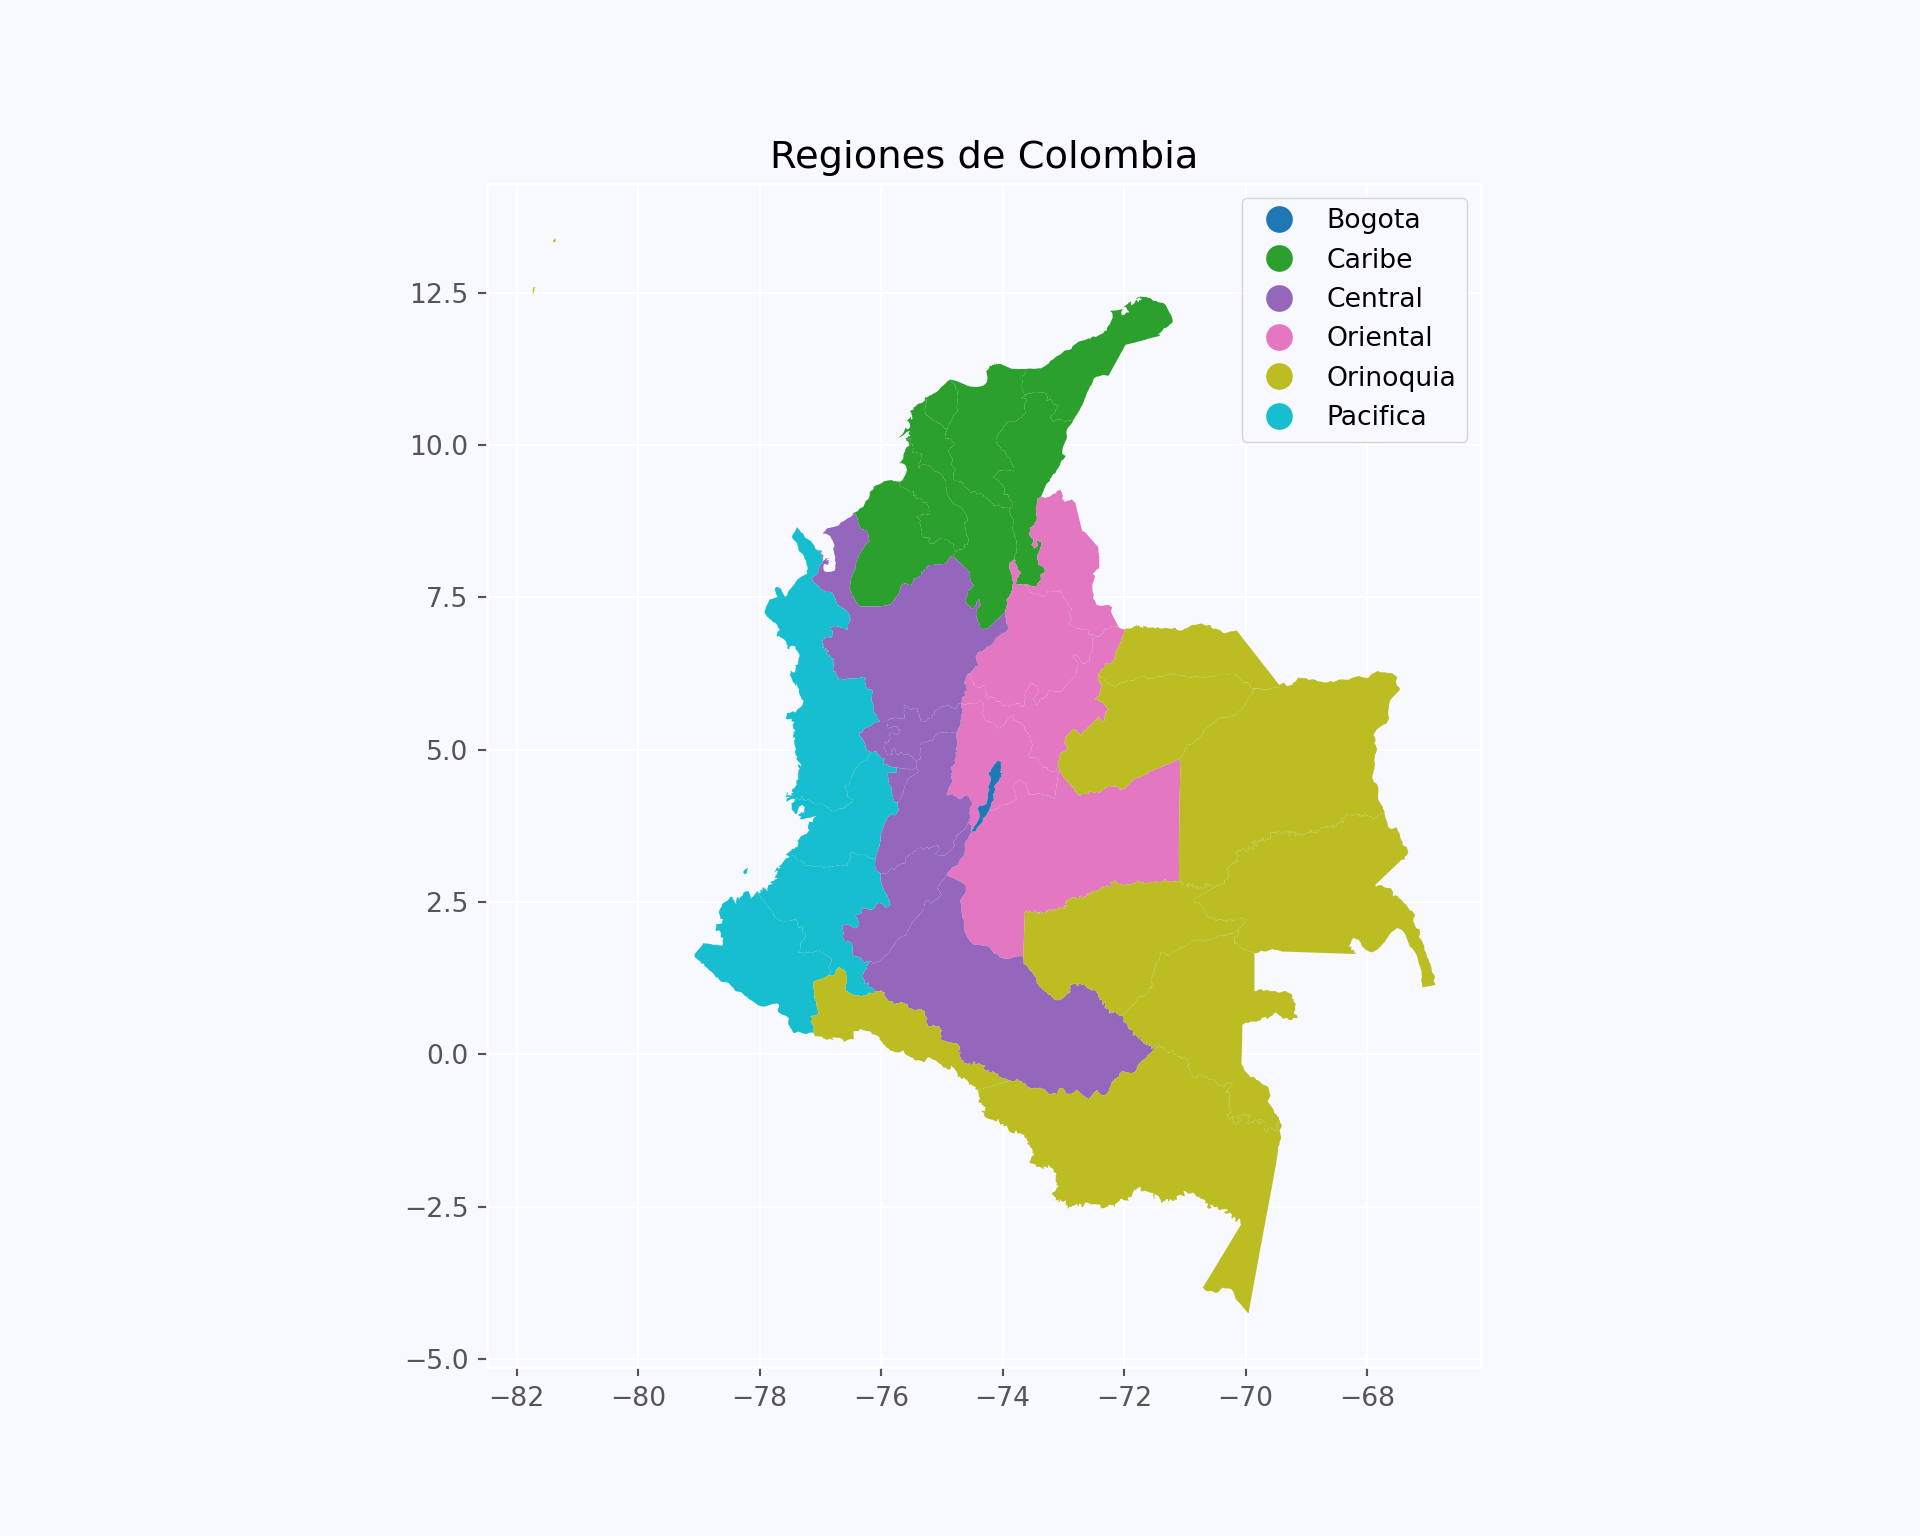
regiones_gdf.plot(column='region_name', categorical=True, legend=True, figsize=(10, 8))
plt.title('Regiones de Colombia')
plt.show()