if (!("ggthemes" %in% installed.packages())) {install.packages("ggthemes")}
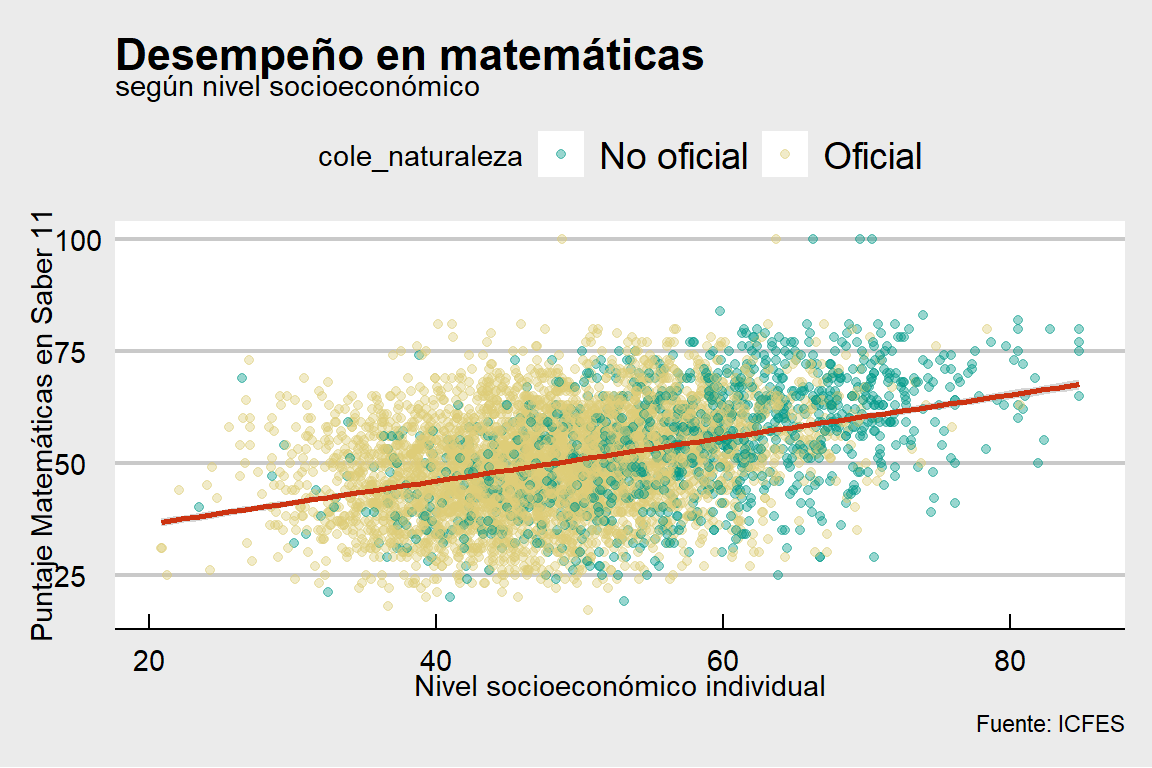
ggplot(data = saber, mapping = aes(x = estu_inse_individual,
y = punt_matematicas)) +
geom_point(aes(color = cole_naturaleza), alpha = 0.4) +
geom_smooth(method = "lm", color = "#c31") +
labs(title = "Desempeño en matemáticas",
subtitle = "según nivel socioeconómico",
x = "Nivel socioeconómico individual",
y = "Puntaje Matemáticas en Saber 11",
caption = "Fuente: ICFES") +
scale_color_manual(values = c('#098', '#dc7')) +
ggthemes::theme_economist_white()