13.3 Grafica para datos discretos
Iniciando, se hace un ajuste al color del fondo de la visualización. Tal vez no sea visible en todas las pantallas.
plt.rcParams['figure.facecolor'] = 'ghostwhite'
plt.rcParams['axes.facecolor'] = 'ghostwhite'
fig, ax = plt.subplots(figsize=(6, 4))
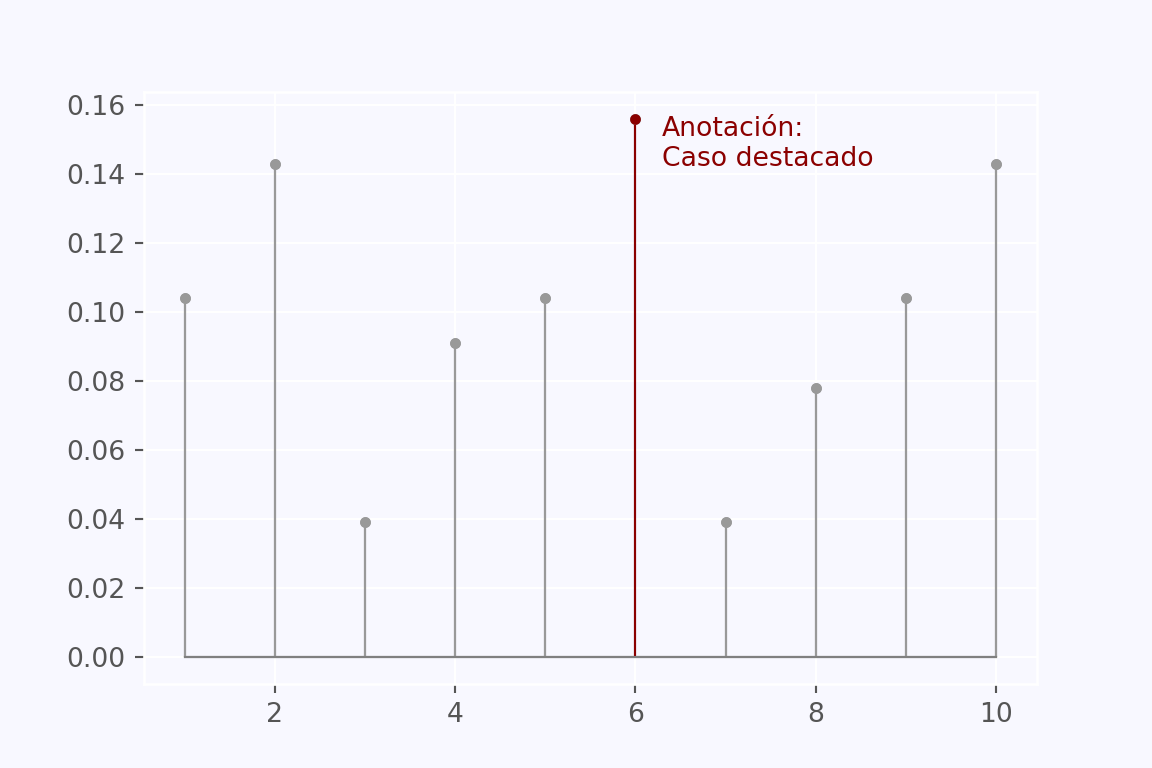
x = np.arange(1, 11)
y = np.array([8, 11, 3, 7, 8, 12, 3, 6, 8, 11])
y = y/np.sum(y)
markerline, stemlines, baseline = ax.stem(
x, y,
linefmt='0.6',
basefmt='0.5',
bottom=0)
# fig, ax = plt.subplots(figsize=(6, 4))
i = 5 # sexta aguja
markerline, stemlines, baseline = ax.stem(
x, y,
linefmt='0.6',
basefmt='0.5')
n = len(stemlines.get_segments())
cols = ['0.6'] * n
cols[i] = 'darkred'
stemlines.set_colors([ncolores.to_rgba(c) for c in cols])
# Renderiza encima
_ = ax.plot(x[i], y[i], 'o', color='darkred')
# Nota en la punta de la varilla
_ = ax.annotate("Anotación:\nCaso destacado",
xy=(x[i], y[i]),
xytext=(10, -20),
textcoords="offset points",
ha="left", va="bottom",
color="darkred")